Descrição
Bias Analyzer — um painel “contexto de mercado” limpo e baseado em regras
A maioria dos erros de negociação não são entradas ruins — são boas entradas no contexto errado.
O Bias Analyzer foi criado para resolver isso: ele oferece uma leitura direcional consistente usando dois motores independentes e mostra o resultado diretamente no seu gráfico.
Importante: O Bias Analyzer é uma ferramenta analítica e visual. Ele não abre, modifica ou fecha negociações.
O que o Bias Analyzer mostra
✅ Um painel compacto no canto superior esquerdo com:
- Viés Heikin (Altista / Baixista / Pendente)
- Viés da sessão (Altista / Baixista / Neutro / Pendente)
- Viés de alinhamento final (Altista / Baixista / Neutro / Pendente)
- % de confiança para o motor da sessão
- Estatísticas por sessão: ADV% vs STD%, Δ pips, contagem de surtos, dominância
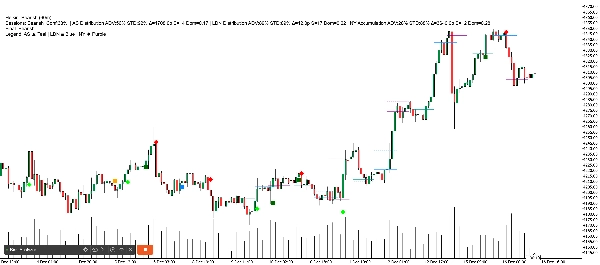
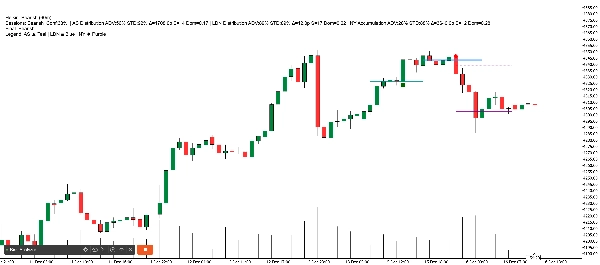
✅ Linhas POC da sessão (sessão mais recente ou histórico multi-sessão)
- ADV POC = linha sólida mais grossa (primária)
- STD/Base POC = linha pontilhada (comparação opcional)
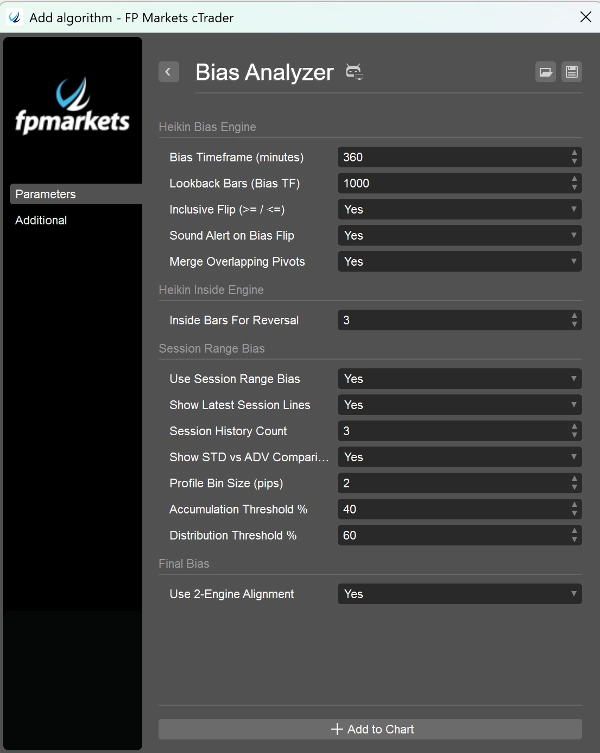
Motor 1 — Viés Pivot Heikin Ashi (estrutura)
Este motor lê “trocas de cor” Heikin Ashi no seu Período de Viés escolhido e constrói zonas pivot:
- Mesclagem opcional de pivôs sobrepostos
- O viés muda quando o preço rompe a última zona oposta (inclusiva ou estrita)
- Inclui um módulo de coil inside-bar (apenas corpo) para contexto precoce de continuação/reversão
Use-o como seu filtro de “pressão” de período superior.
Motor 2 — Viés do Intervalo da Sessão (Ásia / Londres / Nova York)
O Bias Analyzer avalia as sessões Ásia, Londres e Nova York mais recentes e completas e aplica uma rigorosa votação 2-de-3:
- Cada sessão calcula Mínimo/Máximo e um POC
- As sessões são classificadas conforme onde o POC está dentro do intervalo da sessão:
-
- Perto do fundo → Acumulação (voto altista)
- Perto do topo → Distribuição (voto baixista)
- Meio → Balanceado (sem voto)
ADV POC (o diferencial)
Em vez de tratar os corpos das velas como “verdade”, o ADV foca onde o preço foi rejeitado com volume:
- Detecta velas M15 surtos (volume de ticks ≥ vela anterior)
- Usa intervalos apenas de pavio e distribui volume pelo comprimento do pavio
- Adiciona ponderação de intenção usando:
-
- desequilíbrio do pavio na vela de surto
- cor da próxima vela
- primeira violação do máximo/mínimo do surto mais tarde na mesma sessão
- Constrói um perfil da sessão e seleciona o melhor ADV POC
STD/Base POC permanece disponível para comparação (para que você veja o que o ADV está mudando).
Viés Final (Alinhamento)
Quando o alinhamento dos 2 motores está ativado:
- Se Heikin + Sessões concordam → Final = Altista/Baixista
- Se eles conflitam → Final = Neutro
- Se os dados forem insuficientes → Final = Pendente
Isso foi projetado para mantê-lo fora de condições de “mensagens mistas”.
Funciona melhor em
- Qualquer símbolo com volume de ticks consistente (Forex majors/minors, índices, metais recomendados)
- Qualquer período de gráfico (usa internamente M5 para intervalos de sessão e M15 para surtos ADV)
Aviso de risco
Negociar envolve riscos. O Bias Analyzer fornece apenas informações analíticas e não garante resultados. Sempre teste em uma conta demo e use sua própria gestão de risco.