説明
マルチタイムフレームトレンドスキャナー – 市場の全体像を一目で把握
マルチタイムフレームトレンドスキャナー は、複数のタイムフレーム のトレンドをクリーンでコンパクトに、cTraderチャート上で直接表示します – M5からD1まで – さらに明確な全体の取引バイアスも示します:
➡️ 強い買い / 買い / 中立 / 売り / 強い売り
チャートを行き来して推測する代わりに、構造化されたマルチタイムフレームのトレンドマップを一か所で得られます。
🧠 スマートトレンドスコアエンジン
有効な各タイムフレーム(M5、M15、M30、H1、H4、D1)について、インジケーターは3つの主要な要素を使って堅牢なトレンドスコアを計算します:
- 📈 EMA(トレンドの方向と傾き)
-
- 価格とEMAの位置(上か下か)
- EMAの傾き(上昇/下降)
- 💪 RSI(モメンタム)
-
- 50レベル周辺で正規化
- 🌊 ATR(オプションのボラティリティフィルター)
-
- 超低ボラティリティの条件をオプションで無視可能
各タイムフレームは -100から+100 の範囲でスコアを得て、それを簡単な状態に変換します:
- 🟢 上昇 – 強気のバイアス
- 🔴 下降 – 弱気のバイアス
- 🟡 フラット – 横ばい / 不明瞭
どのタイムフレームが同意しているか、そして本当の方向性バイアスがどこにあるかを即座に確認できます。
📊 チャート上のクリーンで軽量なダッシュボード
ツールはチャートの上に 小さなUIパネル を描画し、読みやすくかつ邪魔にならないよう設計されています:
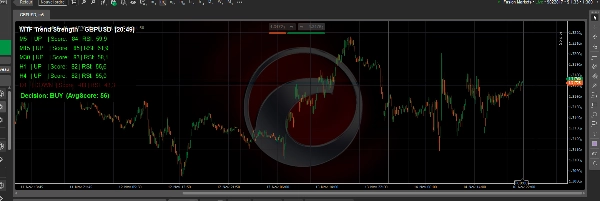
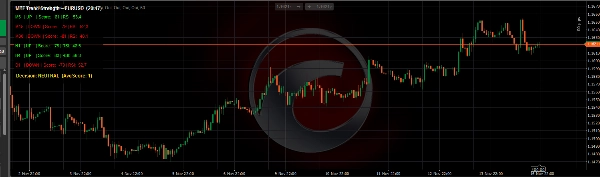
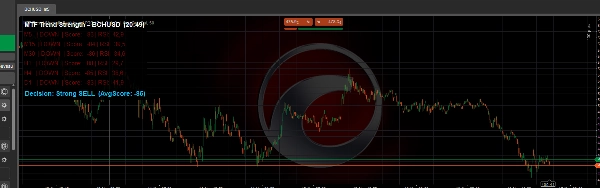
- 各タイムフレームごとに1行、例えば:
M15 | UP | Score: 63 | RSI: 61.2 - 色分け:
-
- 上昇は緑色
- 下降は赤色
- フラットは金色
- パネルは 左上 または 右上 コーナーに配置可能
- 調整可能なパネル:
-
- 背景色と不透明度
- フォントサイズ
- 行の高さ
- 強気 / 弱気 / 中立の色
スキャルパー、デイトレーダー、スイングトレーダーが大局を素早く確認するのに最適です。
🧭 グローバルトレーディングバイアスライン
パネルの下部に、マルチタイムフレームトレンドスキャナー はすべてのアクティブなタイムフレームの 平均スコア を計算し、それを明確なグローバルバイアスに変換します:
- ✅ 強い買い – タイムフレーム間で強い強気の整合性
- ✅ 買い – 強気のバイアスだが極端ではない
- ⚪ 中立 – 混合または不安定な市場
- ❌ 売り – 弱気のバイアス
- ❌ 強い売り – 強い弱気の整合性
これにより、以下のための トレンドおよび方向フィルター として理想的です:
- 手動取引(バイアスの方向にのみ取引)
- 上位タイムフレームの確認を伴うスキャルピングエントリー
- H1 / H4 / D1に合わせたスイングトレード
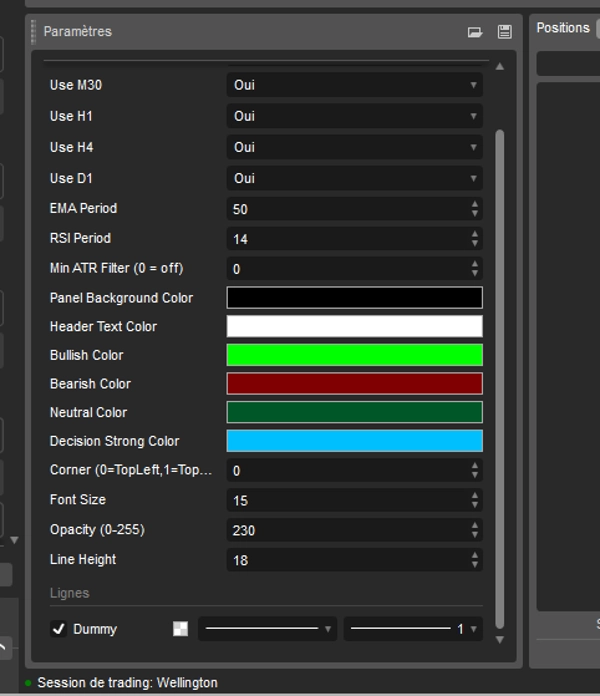
🔧 完全カスタマイズ可能
ロジックと見た目を完全にコントロールできます:
- 各タイムフレームの有効化/無効化(M5、M15、M30、H1、H4、D1)
- 設定:
-
- EMA期間(トレンド感度)
- RSI期間(モメンタムの挙動)
- ATR最小フィルター(0 = オフ)
- ビジュアル設定:
-
- パネルの背景色と透明度
- ヘッダーと行テキストの色
- 強気 / 弱気 / 中立 / 強いバイアスの色
- フォントサイズと行間隔
インジケーターはcTraderがサポートするすべてのシンボルで動作します: FX、指数、ゴールド、暗号通貨、株式。
複数のタイムフレームにわたるトレンドの整合性を明確かつ客観的に視覚的に読み取り、市場が買い、売り、または様子見に適しているかを素早く判断したい場合、マルチタイムフレームトレンドスキャナー はあなたのcTraderツールボックスに強力な追加となります。
概要
The indicator displays a compact, color-coded dashboard on the chart, showing one line per timeframe with trend status, score, and RSI value. Users can customize the panel’s position, colors, font size, and which timeframes to include. A global trading bias line at the bottom summarizes the average score across timeframes into five bias states: Strong BUY, BUY, NEUTRAL, SELL, and Strong SELL. This feature supports manual trading, scalping, and swing trading by providing clear directional guidance.
Multi Timeframe Trend Scanner works on any cTrader-supported symbol, including forex, indices, commodities, cryptocurrencies, and stocks. It is designed to help traders quickly assess trend alignment and market bias in a single, easy-to-read interface.
カスタマーレビュー
5 | 100 % | |
4 | 0 % | |
3 | 0 % | |
2 | 0 % | |
1 | 0 % |