説明
PnL Studio
cTraderの取引履歴を視覚的なパフォーマンスダッシュボードに変換し、取引パターン、強み、改善点を即座に把握できます。
PnL Studioは、取引履歴を明確な視覚的ダッシュボードに変換する強力な分析プラグインです。長い取引リストをスクロールする代わりに、日、週、戦略ごとの取引パフォーマンスを素早く理解できます。
カレンダーに基づくパフォーマンストラッキング、主要統計、および詳細な取引検査ツールにより、PnL Studioはトレーダーが結果を分析し、意思決定を改善できるパターンを特定するのに役立ちます。
主な機能
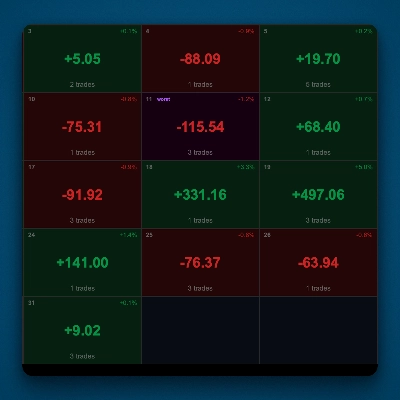
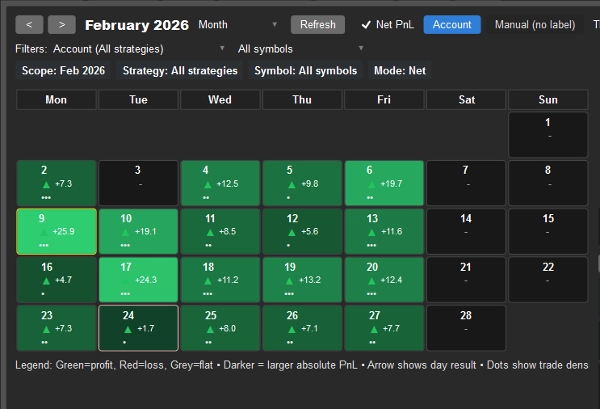
視覚的な取引パフォーマンスカレンダー
色分けされたカレンダーヒートマップで各取引日のパフォーマンスを即座に確認できます。
• 緑 = 利益のある日
• 赤 = 損失の日
• 色が濃いほどPnLが大きい
• アクティビティインジケーターは取引の強度を示す
• 方向矢印は勝ち日または負け日を強調表示
任意の日をクリックして、その結果を生み出した取引の詳細を掘り下げてください。
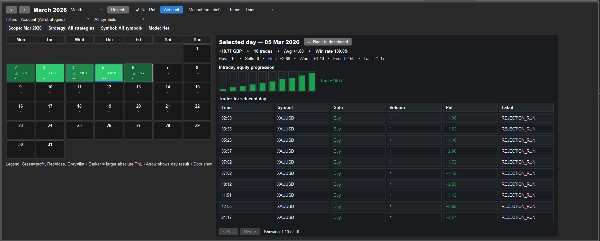
日別取引レビュー
カレンダーから任意の日を選択して、その結果の背後にある正確な取引を検査します。
表示内容:
• シンボル、方向、ボリューム、PnLを含む取引リスト
• 各取引の戦略ラベル
• 日中の資産推移
• ベストトレード、ワーストトレード、勝率を含む日別統計
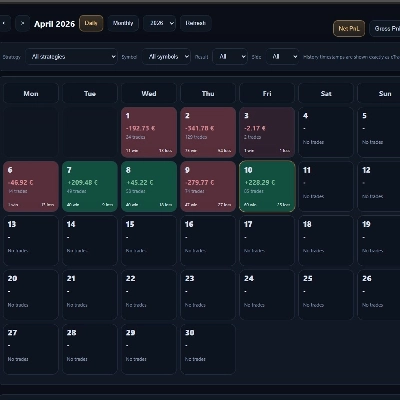
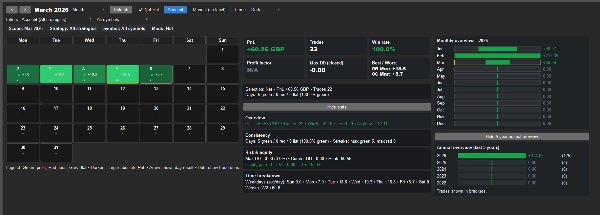
月間パフォーマンスダッシュボード
以下の主要指標を含む月間取引パフォーマンスを素早く理解できます:
• 総PnL
• 取引回数
• 勝率
• 利益率
• 最大クローズドドローダウン
• 最良および最悪の取引日
戦略およびシンボルのフィルタリング
柔軟なフィルターを使って特定の戦略や市場を分析します。
結果を以下でフィルタリング:
• 戦略ラベル
• シンボル
• 総または純PnL
• 時間範囲(月または年)
戦略パフォーマンス概要
各戦略ラベルの結果を自動的に要約し、パフォーマンスを素早く比較できます。
含まれる内容:
• 総利益
• 平均取引結果
• 取引回数
• 戦略の強さ評価
長期パフォーマンスの洞察
組み込みの要約で時間を通じた一貫性を追跡します:
• 現在の年の月間概要
• 5年間の年間パフォーマンス内訳
より深い洞察を求めるトレーダーのために作られました
手動取引でも自動戦略の運用でも、PnL Studioは取引のパフォーマンスを時間を通じて理解するのに役立ちます。
以下の用途にご利用ください:
• 利益のある取引日を特定する
• パフォーマンスパターンを検出する
• 戦略の挙動を分析する
• 取引の一貫性を監視する
他のAWTradesツールと連携して動作します:
PnL Studioは、トレーダーがパフォーマンスとリスクをより明確に理解できるよう設計されたAWTradesツールキットの一部です。
以下と組み合わせて使用できます:
• Risk Watch – 現在のエクスポージャー、最悪のリスク、アカウント全体のオープンポジション集中度を表示するライブリスク監視プラグイン。
• Trade Analytics – 期待値、一貫性、利益集中度など、取引の統計的品質を評価する高度なダッシュボード。
これらのツールを組み合わせることで、より完全な取引ワークフローが実現します:
PnL Studio – 視覚的なパフォーマンスレビュー
Risk Watch – ライブリスクとエクスポージャーの監視
Trade Analytics – エッジの品質と堅牢性の分析
シンプルで軽量
PnL StudioはcTrader内で直接動作し、外部ソフトウェアを必要としません。
単にPnL Studioタブを開くだけで、取引パフォーマンスを即座に視覚化・分析できます。
概要
カスタマーレビュー
5 | 33 % | |
4 | 67 % | |
3 | 0 % | |
2 | 0 % | |
1 | 0 % |