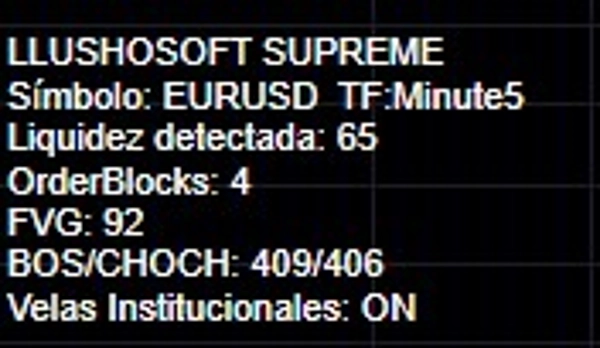
🔥 Estrutura Suprema de Liquidez LlushoSoft
Leitura do Mercado Institucional — Clara. Agressiva. Inequívoca.
Existem indicadores que você usa, e existem indicadores que mudam a forma como você negocia.
A Estrutura Suprema de Liquidez pertence à segunda categoria.
Construído para traders que exigem clareza institucional — sem ruído, sem sinais atrasados, sem fantasias que se redesenham. Esta ferramenta decodifica a verdadeira estrutura do mercado em tempo real, expondo o comportamento da liquidez, execução do dinheiro inteligente, eventos de deslocamento, mudanças BOS/CHOCH e zonas de prêmio/desconto com precisão cirúrgica.
Sem suposições.
Sem adivinhações.
Apenas a verdade. Visível. Brutal. Aplicável.
Quando você a instala, não está adicionando algo ao seu gráfico.
Você está removendo a cegueira.
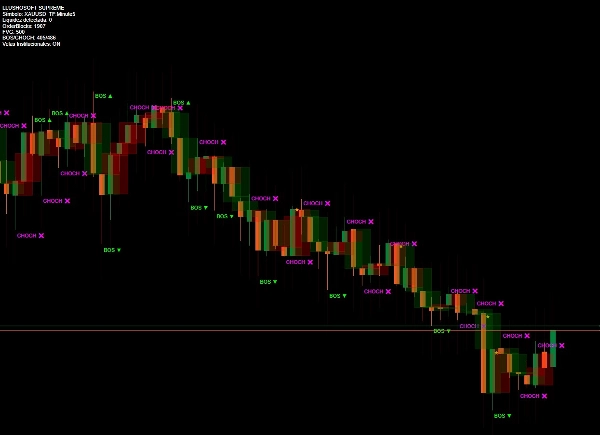
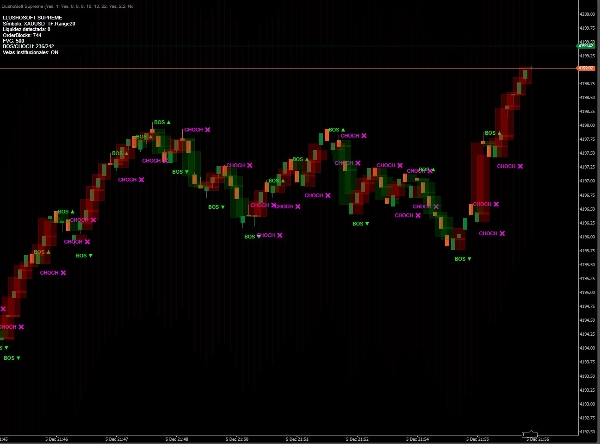
🔥 O Que a Estrutura Suprema de Liquidez Mostra Para Você
ComponenteO que revela
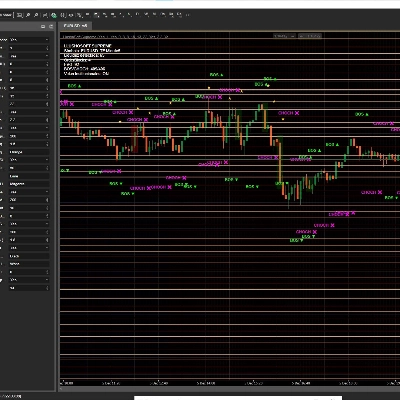
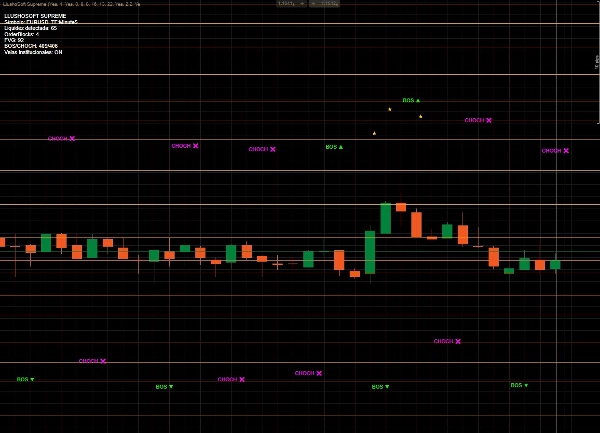
Detecções BOS / CHOCH
Identifique quando a estrutura da tendência realmente muda — não depois, mas enquanto acontece.
Zonas de Liquidez Institucional
Pare de adivinhar onde o preço vai atacar. A liquidez é destacada abertamente.
Viés de direção do fluxo de ordens
Identifique quem controla o mercado — compradores ou vendedores — e quando o controle muda.
Reconhecimento de Desequilíbrio / FVG
Entenda onde o preço deve retornar para reequilibrar a ineficiência.
Níveis institucionais + pontos de varredura
Saiba onde são planejadas as caçadas de stops e onde as reações são prováveis.
Zonas de execução
Áreas claras para entradas com risco reduzido e invalidação definida.
Cada camada complementa a próxima.
Cada linha tem significado.
O gráfico se torna um mapa — e o mercado deixa de ser um mistério.
🧠 Para Quem é Este Indicador?
✔ Operadores de Smart Money / ICT
✔ Scalpers buscando execuções precisas
✔ Swing traders trabalhando mudanças estruturais
✔ Estrategistas baseados em fluxo de ordens e liquidez
✔ Traders que querem compreensão do mercado, não setas
Se alguém quer atalhos, sinais ou previsões mágicas — esta ferramenta não é para eles.
Mas para aqueles sérios sobre controlar suas negociações com lógica institucional —
esta é uma arma.
🏆 Por Que Você Quer Isso — Por Que Vale a Pena Comprar
Porque clareza é cara, confusão é mais cara,
e a cegueira do varejo custa mais do que este indicador jamais custará.
A Estrutura Suprema de Liquidez oferece a você:
🔹 Confiança — você sabe por que o preço se move.
🔹 Precisão — as entradas não são esperanças; são calculadas.
🔹 Compreensão — você vê o que os algoritmos institucionais visam.
🔹 Controle — você para de reagir e começa a antecipar.
Isto não é um risco — isto é alavancagem.
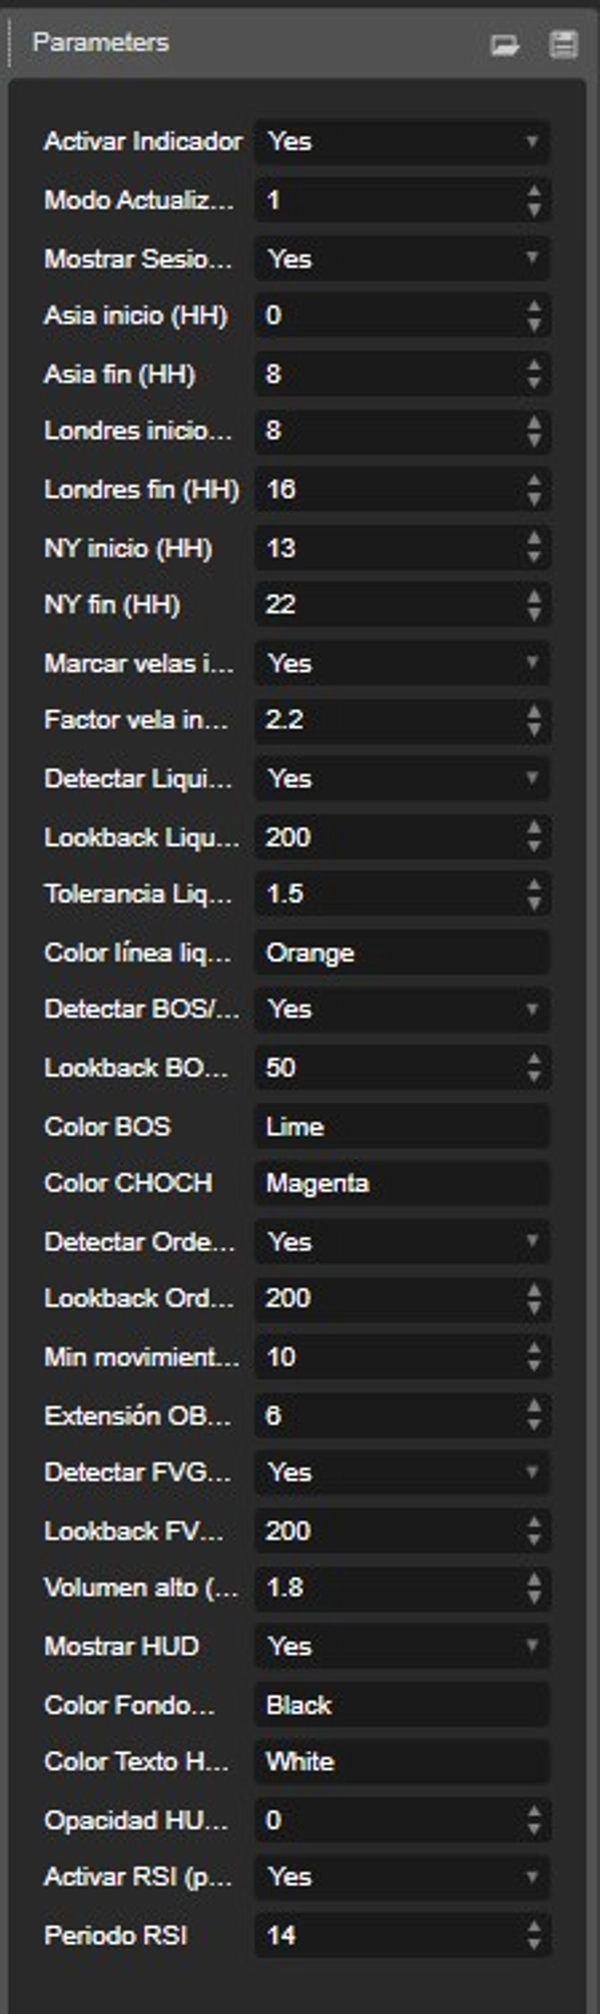
📘 Como Usar a Estrutura Suprema de Liquidez
Um processo simples — resultados poderosos.
- Identifique Pools de Liquidez
Zonas de máximos/mínimos iguais ou liquidez planejada aparecem visualmente.
Estas são áreas onde o Smart Money buscará ordens. - Espere pela Mudança BOS/CHOCH
A quebra da estrutura confirma a direção.
Isso indica quando a acumulação termina e a expansão começa. - Localize Desequilíbrio / FVG
O preço tende a retornar para mitigar a ineficiência — pontos de entrada de alta probabilidade. - Alvo na Liquidez Oposta
Você sabe para onde o preço vai a seguir:
liquidez <-- sempre o destino. - Execute Com Lógica Institucional
Entradas, stops e alvos tornam-se óbvios: -
- Entre após a confirmação da estrutura
- Stop abaixo do ponto de invalidação
- Alvo no próximo cluster de liquidez
Sem configurações avançadas.
Sem configurações complicadas.
Coloque no seu gráfico — ele conta a história.
⚡ Benefícios Principais que os Traders Experimentam
• Visão clara do movimento institucional
• Identificação precoce de reversões de tendência
• Zonas de execução de alta probabilidade
• Redução da incerteza e do trading emocional
• Projetado para decisões rápidas
• Funciona em qualquer mercado e timeframe
Forex · Índices · Cripto · Futuros · Metais —
Se tem preço, esta ferramenta o lê.
🧩 Por Que Se Destaca
A maioria dos indicadores mostra o que já aconteceu.
A Estrutura Suprema de Liquidez mostra o que importa e o que vem a seguir.
Não porque prevê — mas porque as instituições são previsíveis.
Você só precisa das lentes certas.
Agora você as tem.
🔥 Você não observa o mercado.
Você o entende.
Você o controla.
Se você está pronto para negociar com os olhos abertos —
A Estrutura Suprema de Liquidez é a ferramenta.


