
説明
問題点:情報過多
ほとんどのトレーダーは、チャートが遅行指標や多くのラインで混雑しているため失敗します。彼らは最も重要なことを見失っています:マーケット構造。
解決策:トレンドバイアス構造
このインジケーターはcTraderプラットフォーム向けの「2イン1」パワーハウスです。プロフェッショナルグレードのスイング検出と、市場の支配者を正確に教えてくれる客観的なスコアリングエンジンを組み合わせています。
主な特徴:
- スマート構造マッピング: ATRでフィルタリングされたボラティリティを使用して、重要なサポートおよびレジスタンスレベルを自動的に特定します。
- SGEスコアリングエンジン: 構造レベルの突破数に基づいてトレンドの強さを計算する独自の評価システム(-2、0、+2)。
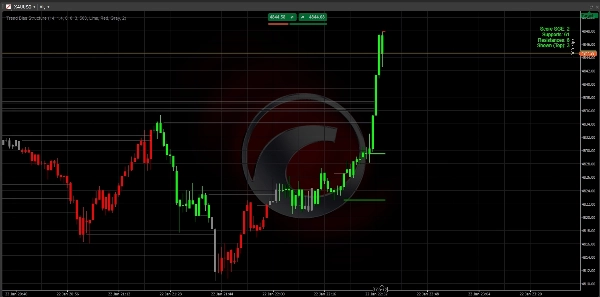
- アンチクラッター技術: 現在の価格に最も近い関連レベル3つのみを表示。チャートはクリーンでプロフェッショナルかつ実用的に保たれます。
- モメンタム検出: 「ビッグキャンドル」ロジックを使用し、実際の機関投資家の支援がある動きのみを取引します。
- 完全カスタマイズ可能: 特定の資産(XAUUSD、Forex、または指数)に合わせて感度を調整できます。
使い方:
- スコアを確認: +2(強気)または -2(弱気)を探します。
- プルバックを待つ: 価格が描画された構造ラインのいずれかに戻るのを待ちます。
- 実行: バイアスに沿って取引し、レベルをエントリー/エグジットのアンカーとして使用します。
技術仕様
- プラットフォーム: cTrader
- 言語: C# (.NET)
- タイムフレーム: すべてのタイムフレーム(M1から月足まで)で動作します。
- 資産: 高流動性ペア(XAUUSD、EURUSD、GBPUSD)に最適化。
注意:初期設定: ほとんどの主要ペアではデフォルト設定が最適化されています。ボラティリティの高い指数を取引する場合は、Range Global ATR Multを2.0に増やすことを検討してください。
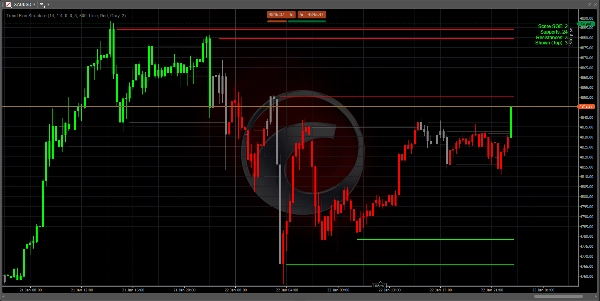
重要:ダッシュボードの読み方
右上のダッシュボードはあなたの指令センターです:
- スコア +2(緑): 強い強気。買いのセットアップのみを探します。
- スコア -2(赤): 強い弱気。売りのセットアップのみを探します。
- スコア 0(灰色): 中立。市場はレンジまたは移行中です。忍耐強く待ちましょう。
- サポート/レジスタンス: 現在のトレンドに存在する過去の「床」と「天井」の数を表示します。
3ステップエントリーストラテジー
ステップ1:バイアスの特定 キャンドルの色とダッシュボードのスコアが+2または-2に達するのを待ちます。これにより、市場が構造を破り、トレンドが始まったことが確認されます。
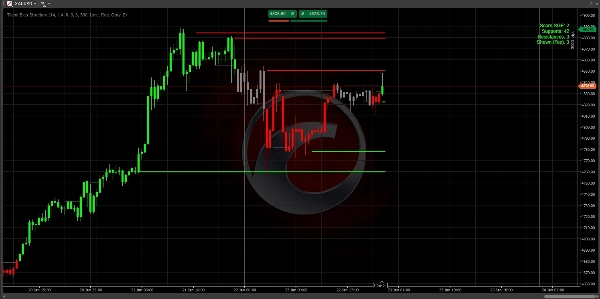
ステップ2:バリューエリア 価格を追いかけず、価格がチャートに描かれた最も近い3本のラインのいずれかにプルバック(戻り)するのを待ちます。
- ダウントレンド(スコア -2)の場合、価格が赤いラインに触れるのを待ちます。
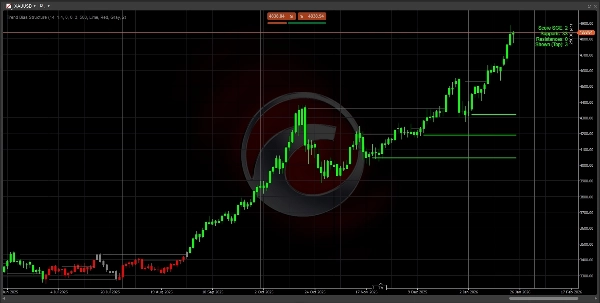
- アップトレンド(スコア +2)の場合、価格が緑のラインに触れるのを待ちます。
ステップ3:実行 価格がラインに触れ、拒否(ウィック形成)を示したときに取引を開始します。
- ストップロス: ストップロスは構造ラインのすぐ後ろに置きます。
- テイクプロフィット: トレンド方向の次の構造ラインをターゲットにします。
成功のためのプロのヒント
- 高タイムフレームのルール: H4またはD1チャートでのスコア+2は、M5チャートでのスコアよりもはるかに強力です。高タイムフレームでバイアスを見つけ、低タイムフレームでエントリーを探します。
- クリーンなチャート: 画面が混雑していると感じたら、設定に移動して
Max Levels to Showを2に変更してください。これにより、最も重要な「床」と「天井」のみが表示されます。 - 「ゼロ」ゾーン: スコアが0のとき、市場は「再計算中」です。これは、以前の取引から利益を確定し、新しいブレイクアウトを待つのに最適な時期です。
トラブルシューティング
- ラインが見えない? チャートに十分な履歴が読み込まれているか確認してください。インジケーターはATRとスイングレベルを計算するために少なくとも100〜200バーが必要です。
- インジケーターの遅延? PCが遅い場合は、
Max Historical Linesの設定を200に減らしてメモリを速くクリアしてください。
よくある質問(FAQ)
Q: このインジケーターは再描画しますか?
A: いいえ。レベルとスコアは確定したキャンドルのクローズに基づいて計算されます。キャンドルのクローズ時にレベルが破られたりスコアが変わった場合、それは履歴に固定されます。
Q: どのタイムフレームが最適ですか?
A: ロジックは普遍的です。ただし、ほとんどのプロトレーダーはH1、H4、または日足チャートで「機関構造」を特定するために使用します。M1やM5でスキャルピングする場合は、スコアの変化がより頻繁に起こることを予想してください。
Q: 他のインジケーターと一緒に使えますか?
A: はい!「方向性フィルター」として完璧に機能します。例えば、トレンドバイアススコアが+2のときのみRSIの売られ過ぎシグナルを取るなどです。
良いトレードを!
金融アドバイスではありません。 トレンドバイアス構造インジケーターは、市場構造とトレンドバイアスを特定するためのテクニカル分析ツールです。
概要
Key features include:
- Smart Structure Mapping: Automatically detects significant support and resistance levels filtered by ATR-based volatility.
- SGE Scoring Engine: Calculates trend strength by counting breached structural levels.
- Anti-Clutter Display: Shows only the three closest relevant levels to maintain chart clarity.
- Momentum Detection: Uses "Big Candle" logic to highlight moves with institutional backing.
- Customizable sensitivity for different assets such as XAUUSD, EURUSD, GBPUSD, and indices.
The indicator works on all timeframes from 1 minute to monthly, with professional traders typically using H1, H4, or daily charts to identify institutional structure. The dashboard provides a clear bias score and structural levels to guide trade entries and exits. Users are advised to trade with the bias, waiting for price pullbacks to the nearest structure lines before executing trades.
This tool is intended as a directional filter and can be combined with other indicators like RSI. It does not repaint, as calculations are based on confirmed candle closes.
カスタマーレビュー
5 | 100 % | |
4 | 0 % | |
3 | 0 % | |
2 | 0 % | |
1 | 0 % |


![「[Hamster-Coder] Pivot Points MTF」ロゴ](https://cdn.ctrader.com/image/webp/4c143e5a-309c-40e3-a578-f04d1e133ffa_31159)


