EKVWAP
Indicatore
2.57K download
Versione 1.0, Jan 2025
Windows, Mac
4.3
Recensioni: 6
Descrizione
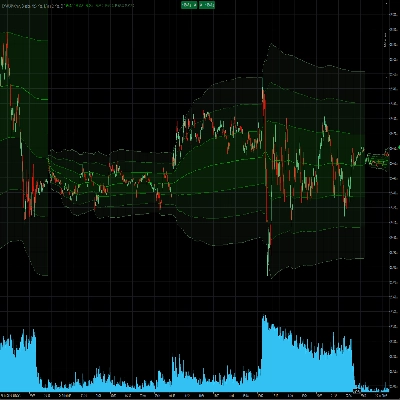
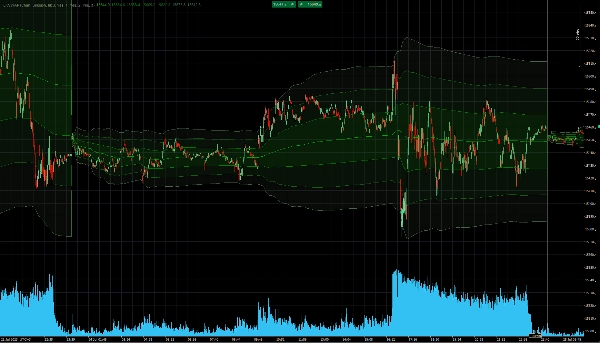
Questo è un indicatore VWAP avanzato che ti permette di personalizzare tutti i suoi aspetti.
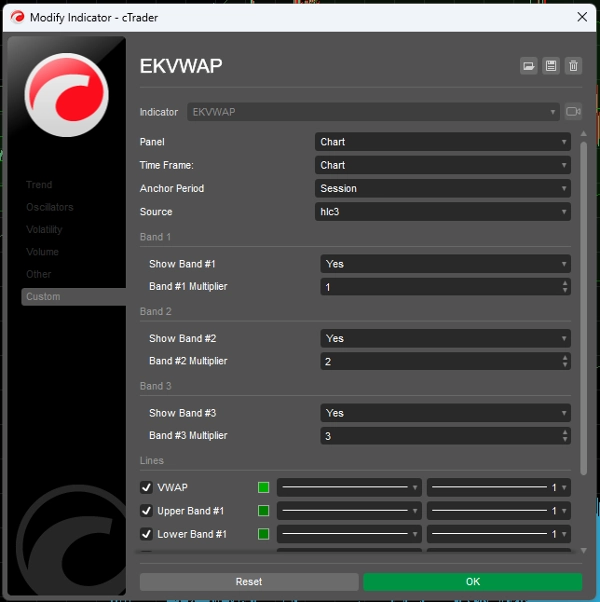
Puoi impostare il VWAP per ancorarsi a:
- Un punto di ancoraggio manuale.
- Per sessione nel caso di mercati che hanno più sessioni nello stesso giorno (es. HK50 o AUS200),
- Per giorno
- Per settimana
Supporta la visualizzazione di fino a 3 bande di deviazione standard. Puoi impostare colori personalizzati per ogni banda e anche impostare i loro moltiplicatori oppure semplicemente nasconderle/mostrarle.
Punto di ancoraggio manuale:
Una volta cliccato su una barra nel grafico, premi i tasti Alt-A (configurabili nelle opzioni) per impostare il punto di ancoraggio manuale per il calcolo del VWAP. Il calcolo inizierà dal punto in cui ti trovavi mentre premendo i tasti Alt-A. Premendo nuovamente Alt-A uscirai dal calcolo manuale del VWAP e tornerai a quello precedente.
Riepilogo
Riepilogo AI
EKVWAP is an advanced Volume Weighted Average Price (VWAP) indicator designed for customizable technical analysis. It allows users to anchor the VWAP calculation to various points, including a manual anchor set directly on the chart, by trading session (useful for markets with multiple daily sessions such as HK50 or AUS200), by day, or by week. The indicator supports the display of up to three standard deviation bands, each with configurable multipliers and colors, which can be shown or hidden according to user preference. Manual anchoring is enabled by selecting a bar on the chart and activating the anchor point via a configurable keyboard shortcut, allowing the VWAP calculation to start from that specific point. This flexibility facilitates detailed volume-based price analysis across different timeframes and market sessions.
Profilo indicatore
Recensioni dei clienti
4.3
Recensioni: 6
5 | 50 % | |
4 | 33 % | |
3 | 17 % | |
2 | 0 % | |
1 | 0 % |
Recensioni dei clienti
August 21, 2025
Nice indicator. My major issue with it is that it automatically fills the bands with the colour selected for the lines. There is no facility to deselect this. Please add the capability to deselect band fill as it can be obtrusive, especially if using colours for another indicator on the chart.
July 9, 2025
Pros: Flexible anchored VWAP with customizable start point. Visual cloud of deviations. Easy integration and stable performance. Cons: No alerts on key levels. No statistics on VWAP re-tests. Lacks tooltip information and quick template saving.
June 18, 2025
June 5, 2025
Really good. all i think is left, is making one on UCT 0. Can you do That? I need to use this indicator to be a reference to a cBot, but i cant do that because the system dont have access to the code. Can you sell one to be used by cBot ¡please!.
Discussioni
Domande frequenti
VWAP
I prodotti disponibili tramite cTrader Store, inclusi bot di trading, indicatori e plugin, sono forniti da sviluppatori terzi e resi disponibili esclusivamente a scopo informativo e di accesso tecnico. cTrader Store non è un broker e non fornisce consulenze in materia di investimento, raccomandazioni individualizzate o garanzie di risultati futuri.


Prezzo
Da 27/11/2024
14.22M
Volume negoziato
8.76K
Profitto in pip
2.57K
Installazioni gratuite