Descrição
Esqueça os indicadores de perfil de volume sobrecarregados que poluem seu gráfico com gráficos desnecessários e consomem recursos excessivos do sistema.
Ao longo dos anos, usei muitos indicadores VP diferentes e gastei uma quantia significativa de dinheiro neles. Nenhum deles ofereceu o equilíbrio entre simplicidade e qualidade que eu procurava, então decidi construir minha própria abordagem.
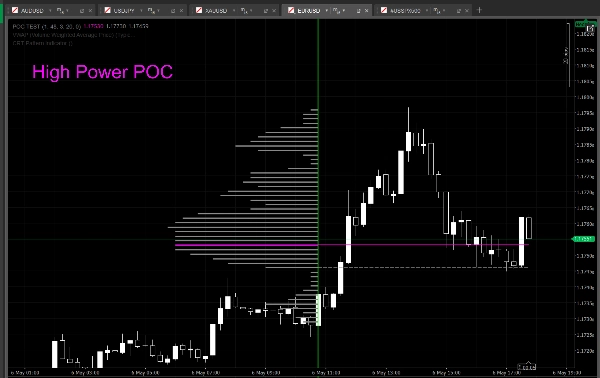
Quando você adiciona o indicador ao gráfico, aparece apenas uma única linha vertical. Essa linha representa o candle onde o cálculo começa. Os pontos High / Low após o candle selecionado são detectados automaticamente pelo indicador e usados para determinar dinamicamente os limites do intervalo do perfil. O histograma junto com os níveis POC / VAH / VAL é criado instantaneamente.
Seu único trabalho é arrastar a linha inicial para o candle desejado e, se necessário, definir um limite de Duração em Minutos nas configurações de entrada. Como a linha se encaixa nos candles como um ímã, o alinhamento incorreto ou uso acidental é quase impossível.
Simples assim.
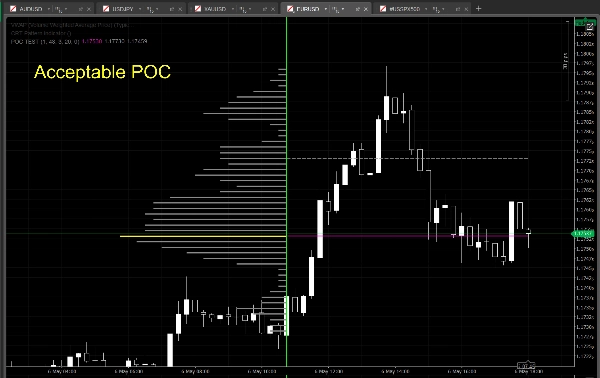
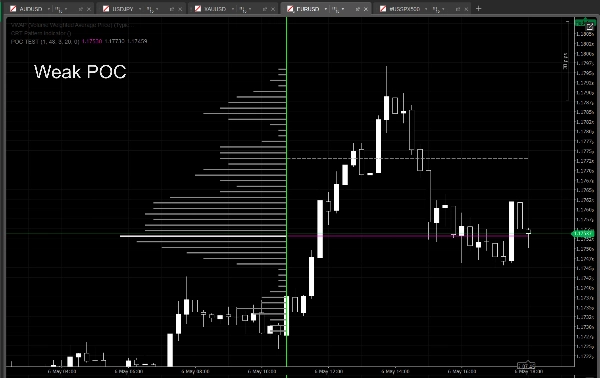
A linha do histograma correspondente ao POC usa 3 cores diferentes para representar a força do POC:
- Branco → POC fraco
- Amarelo → POC aceitável / equilibrado
- Magenta → POC forte
Nota importante:
O candle onde a linha inicial é colocada NÃO está incluído no cálculo. O perfil começa a partir do próximo candle após o selecionado.
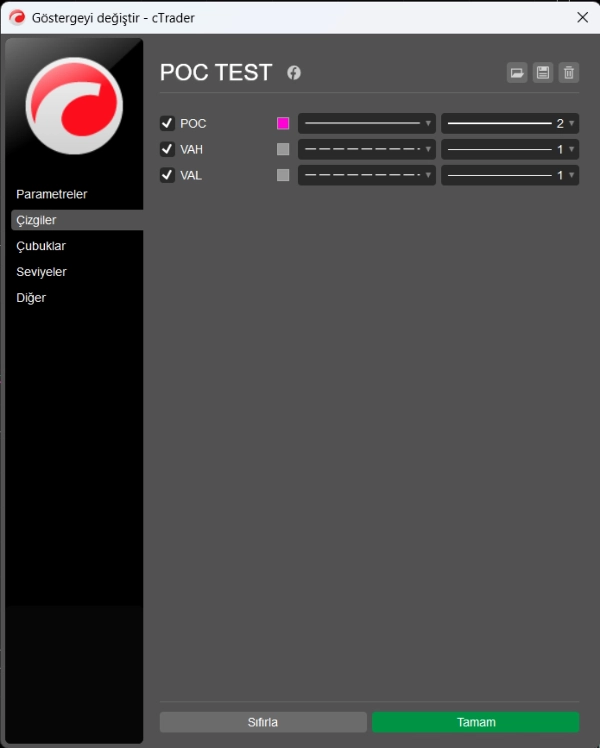
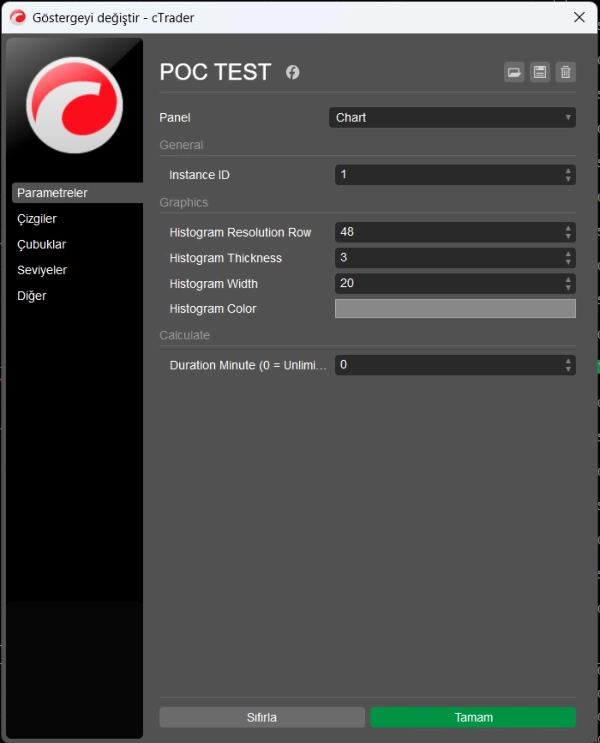
Você pode criar múltiplos perfis independentes no mesmo gráfico usando diferentes valores de Instance ID.
A estrutura dos parâmetros foi intencionalmente mantida simples. Em vez de dezenas de configurações desnecessárias, apenas os controles essenciais estão incluídos. Apesar da aparência limpa, o indicador executa um motor de cálculo altamente refinado em segundo plano.
Alguns dos métodos de cálculo usados internamente:
- Distribuição híbrida de volume ponderado
- Cálculo de viés do preço de fechamento
- Ponderação do corpo do candle
- Lógica de filtragem de varredura / pavio
- Detecção de POC baseada em cluster
- Análise dinâmica da força do POC
- Expansão adaptativa da Área de Valor
- Cálculo estabilizado de VAH / VAL
- Geração de histograma com redução de ruído
- Recalculo em tempo real com baixo consumo de recursos
Nota:
- Para simplicidade e estabilidade, o conjunto de parâmetros foi intencionalmente mantido limitado. Usuários que necessitam de opções de personalização mais avançadas podem me contatar diretamente. Uma versão avançada dedicada pode ser lançada para eles no futuro.
Resumo
Users can drag the start line to select the desired candle, with an optional duration limit setting. The line snaps to candles to prevent misalignment. Multiple independent profiles can be created on the same chart using different instance IDs.
The POC line uses three colors to indicate strength: white for weak, yellow for balanced, and magenta for strong POC. Internally, the indicator employs advanced calculation methods including hybrid weighted volume distribution, close-price bias, candle body weighting, wick filtering, cluster-based POC detection, dynamic POC strength analysis, adaptive value area expansion, stabilized VAH/VAL calculation, noise-reduced histogram generation, and low-overhead real-time recalculation.
The parameter set is minimal, focusing on essential controls to maintain a clean chart appearance without excessive resource consumption. This indicator supports visualization of volume profiles with key market structure levels for enhanced volume-based analysis.


![Logótipo de "Wyckoff Toolkit [Iridio Capital]"](https://cdn.ctrader.com/image/webp/8acfe6a1-6a8e-4578-9367-9df3af2b1801_27763)