الوصف
【cTrader Exclusive】WeisWaveSyncZigZag — Eliminate Disconnection: Flawless Dual-Color Price Structural Engine Built for WWS
■ Overview
"WeisWaveSyncZigZag" is a premium, institutional-grade chart structuring tool designed exclusively for cTrader. Unlike standard or free ZigZag indicators that suffer from lag, messy parameter definitions, and decoupling from volume oscillators, this engine was built from the ground up to perfectly synchronize with the WeisWaveSpike (WWS) oscillator.
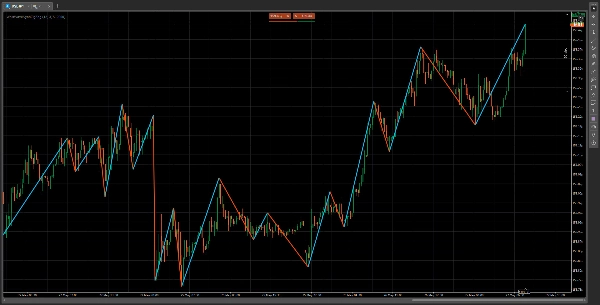
By displaying flawless, dual-color trend segments right on your price action, it bridges the gap between price structure and volume accumulation, offering a pristine visual environment for market structure analysis.
1. Market Data and Conditions Analyzed
This indicator processes real-time price feeds to map out clean, noise-filtered institutional market structures.
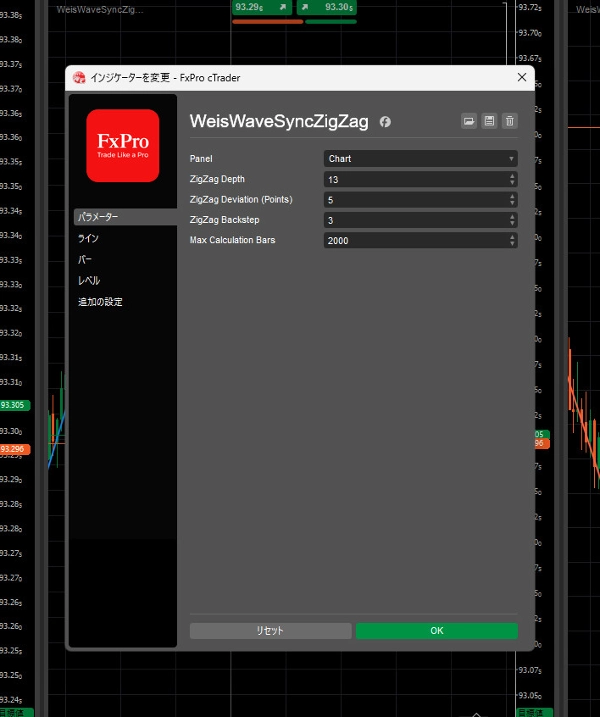
- Pure Price Structure Extraction: Uses a mathematically optimized structural algorithm (Default: Depth 13, Backstep 3, Deviation 5) to connect valid swing highs and swing lows, effectively removing market noise and minor price fluctuations.
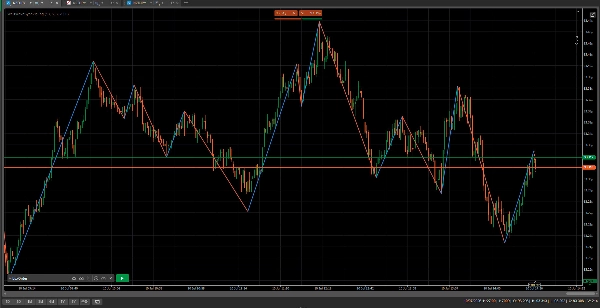
- Dynamic Wave Directionality: Rather than rendering a single-colored line that blinds you to the current directional bias, it continuously assesses whether the market is in an expansion or retracement phase, assigning clear structural boundaries to every single price movement.
2. Signal and Visual Component Interpretation
Engineered with premium neon-contrast styling to perfectly match your WWS setup, enabling instant, error-free interpretation of price trends.
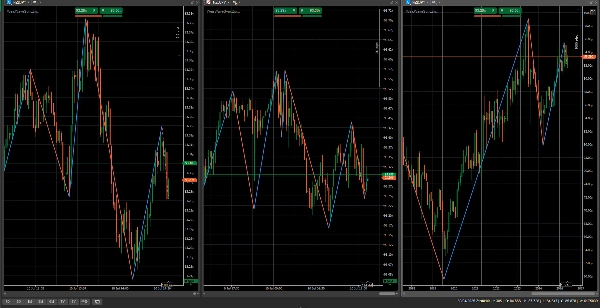
- Up Line Segments 【Cold Tone: DeepSkyBlue】 Drawn from a confirmed swing low to a confirmed swing high. This tells you instantly that the market is in a bullish wave structure. When this line is printing, the WWS oscillator below is simultaneously compounding buying tick volume.
- Down Line Segments 【Warm Tone: OrangeRed】 Drawn from a confirmed swing high to a confirmed swing low. This signals a structural bearish wave. While this line is active, your WWS oscillator is instantly accumulating selling tick volume.
- The Active Real-Time Line (Live Extension) The final segment extending from the last fixed swing point to the live, fluctuating market price. It automatically dynamically updates its color based on the immediate direction of the developing wave, allowing you to witness the exact moment a 5-pip deviation trigger is being tested.
3. Key Settings and Parameters
Fully customizable to suit your exact timeline and risk profiles, allowing seamless adjustments.
- ZigZag Depth (Default: 13): The essential historical lookup period to find swing extremes. Higher numbers focus on macro trends, while lower numbers capture short-term scalping structures.
- ZigZag Backstep (Default: 3): The minimum buffer bars required between consecutive highs/lows to finalize a validated swing point.
- ZigZag Deviation (Pips) (Default: 5.0): The strict, fixed pip-distance filter required to trigger a trend reversal. Set to 5.0 pips out-of-the-box for ideal market harmony.
- Max Bars (Default: 2000): A vital performance optimization parameter. It forces a clean backend refresh of historical trend data on every incoming price change, eliminating typical platform rendering bugs.
4. Typical Use Cases and Trading Scenarios
Scenario A: Perfect Volume-Price Divergence Identification
- Price action on the main chart is printing a long, extended DeepSkyBlue (Up Line) segment, making a slightly higher high.
- At the same time, your WWS oscillator reveals that the cumulative volume for this wave is substantially lower than previous bullish waves.
- [Trading Decision] Thanks to the 100% exact synchronization of the ZigZag line and the volume bar, you spot an immediate structural exhaustion. You prepare for an aggressive reversal entry the second the line turns into an OrangeRed (Down Line).
Scenario B: Validating Breakouts and Climax Points
- The market breaks through a critical horizontal barrier, and the indicator draws a sharp, aggressive trend segment.
- You look down at your WWS oscillator and notice a flash of Neon Cyan or Neon Magenta (indicating a 1.618x volume spike).
- [Trading Decision] You immediately cross-reference the exact start and end coordinate points of that volume surge on your price chart via the dual-color line, determining whether it represents institutional absorption or an institutional breakout drive.
5. Ideal Trader Profile
- Target Level: Intermediate to Professional FX Traders
- Trading Style: Day Trading, Swing Trading, Trend Following, Structural Trading
- Best Suited For:
- Serious traders who demand absolute visual consistency between their main price charts and sub-window volume oscillators.
- Discerning market participants who use Advanced Wyckoff Methodologies, Smart Money Concepts (SMC), or Order Flow trading and need to locate precise swing anchors.
- cTrader enthusiasts who despise poorly coded, lagging free scripts and want a highly optimized, dual-color engine designed to perform under high-volatility conditions.
6. Important Limitations and Usage Notes
- Forex-Only Calibration This software is hardcoded to optimize for currency pair decimal point metrics (PipSize configurations). Loading this indicator onto Equity Indexes, Commodity CFDs, or Cryptocurrencies will trigger an automatic internal safety lock, safely shutting down calculations to protect your chart and displaying a clear red error warning.
- Real-time Synchronization Engine (Recalculation) To eliminate the frustrating visual bugs found in default scripts, this system completely refreshes line object coordinates within the last 2000 bars upon each live tick. When a structural high or low shifts, the historical line path realigns seamlessly. This ensures you are never looking at outdated or lagging historical lines.
- Mandatory Companion Product While this indicator functions beautifully on its own as a dual-color ZigZag, it was structurally engineered to serve as the visual counterpart to the
WeisWaveSpike (WWS)oscillator. Running both simultaneously creates an elite, fully synchronized trading environment.