Описание
Order Block - сигналы структуры рынка
Этот мощный инструмент, разработанный профессиональными трейдерами, уже доказал свою эффективность на реальных торговых счетах.
Ключевые преимущества:
- Универсальность: работает на любых инструментах, рынках и таймфреймах (форекс, криптовалюта, акции, облигации, фьючерсы).
- Точность: показывает лучшие результаты на тиковых графиках, фильтруя быстрые импульсы во время сильных рыночных движений. Также хорошо работает на стандартных таймфреймах.
- Гибкость настроек: позволяет адаптировать индикатор под ваш стиль торговли и предпочтения.
- Визуальная ясность: четко отображает уровни пробоя структуры рынка, сигналы и зоны поддержки/сопротивления (OrderBlock).
Основные функции:
- Динамический расчет и отображение зон OrderBlock
- Сигналы входа (красные и зеленые стрелки)
- Отображение вероятного будущего движения тренда (опционально)
- Регулируемая прозрачность блоков
- Возможность удаления завершенных зон
Всегда учитывайте контекст рынка!
Настройки:
История баров - количество баров для расчета (если слишком много - может нагрузить компьютер). По умолчанию 2000 баров.
Отклонение % Zigzag - основной параметр - расчет от зигзага. Настраивается в зависимости от таймфрейма и инструмента блока
Прозрачность 0-250 - прозрачность блоков Удалять старые/сломанные блоки - удалять ли старые блоки
Удалять стрелки - не показывать стрелки сигналов Расстояние стрелок (множитель ATR) - расстояние от бара до стрелки в ATR ........
Удалять точки - отключить рисование точек (спорная функция - точки показывают вероятное будущее движение тренда)
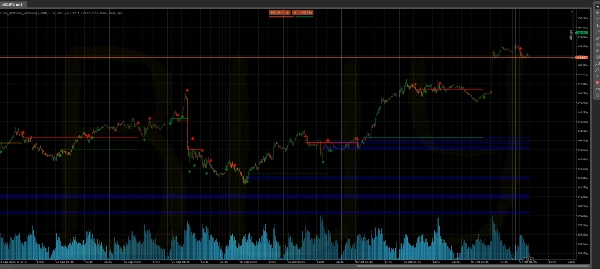
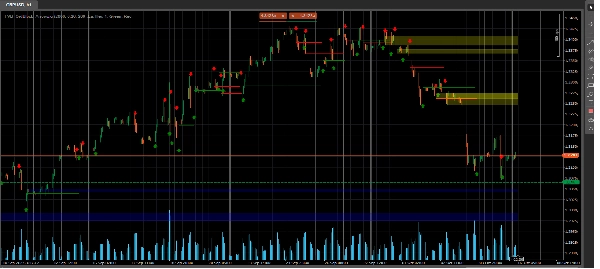
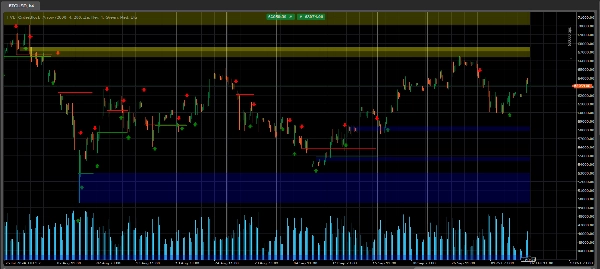
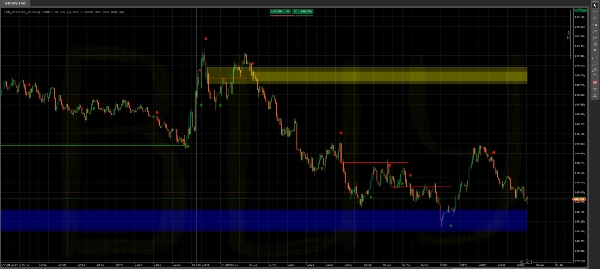
На графике: Красные и зеленые линии - уровни пробоя структуры рынка Красные и зеленые стрелки - сигналы индикатора Полосы - зоны OrderBlock - поддержка и сопротивление. Они динамически рассчитываются и удаляются при завершении (возможность оставить их на графике)
Важно: Код индикатора защищен авторским правом.
Сводка
Отзывы покупателей
5 | 50 % | |
4 | 0 % | |
3 | 50 % | |
2 | 0 % | |
1 | 0 % |