


Deskripsi
Reversal Trap Probability Bands adalah alat deteksi pembalikan yang belajar sendiri yang dibangun di sekitar amplop harga yang adaptif terhadap volatilitas. Alih-alih hanya menandai setiap sentuhan pada pita luar, alat ini secara khusus mencari jebakan "fakeout" — situasi di mana harga mendorong melewati amplop, gagal bertahan, dan berbalik kembali ke dalam — yang sering kali merupakan titik pembalikan dengan probabilitas lebih tinggi dibandingkan hanya sentuhan pita sederhana.
Yang membuat indikator ini berbeda adalah mesin statistik bawaan. Setiap kali sinyal jebakan muncul, indikator mengklasifikasikannya berdasarkan kondisi pasar dan secara diam-diam melacak apakah jenis pengaturan tersebut mencapai targetnya atau terkena stop out. Seiring waktu, indikator ini membangun skor probabilitas langsung untuk setiap kondisi dan menampilkan tingkat kemenangan tersebut langsung di grafik saat pengaturan serupa muncul — jadi Anda tidak hanya melihat sinyal, tetapi juga melihat bagaimana sinyal serupa telah berkinerja secara historis pada instrumen dan kerangka waktu yang sama.
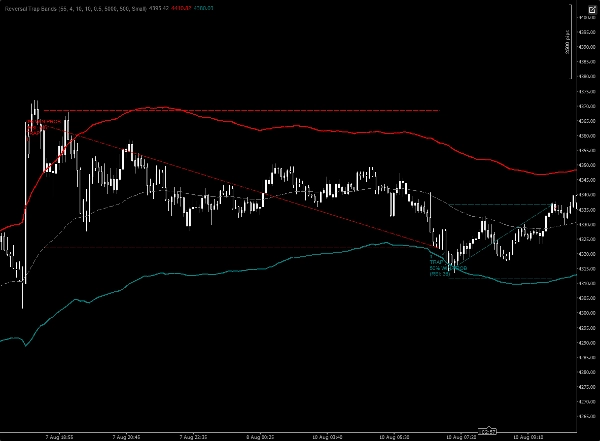
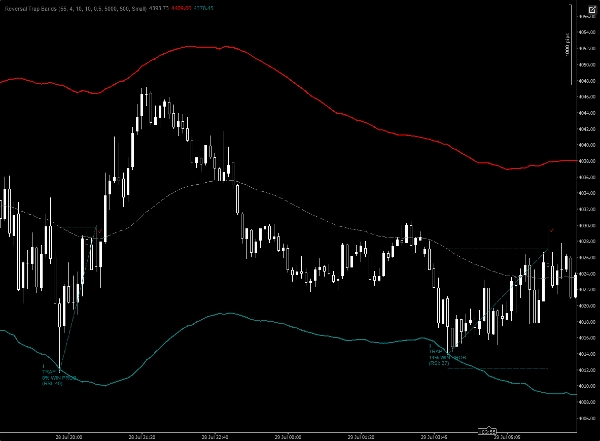
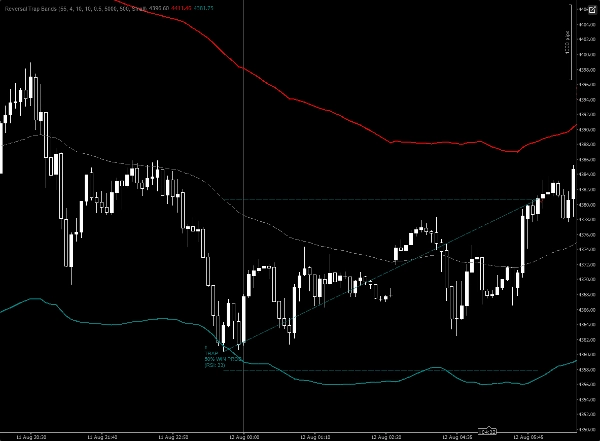
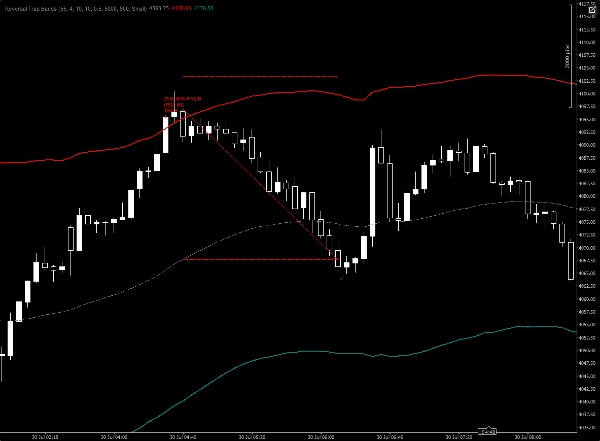
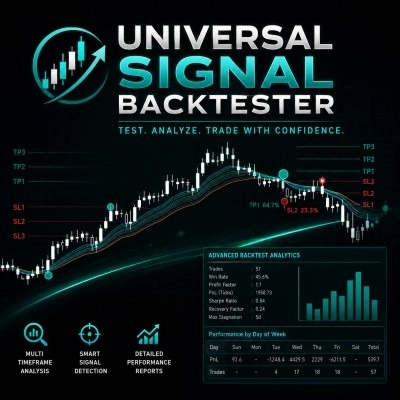
Untuk setiap jebakan yang terdeteksi, indikator menggambar:
- Sinyal arah yang menandai pembalikan
- Level target yang diproyeksikan
- Level stop protektif
- Pembacaan probabilitas kemenangan langsung untuk jenis pengaturan tersebut
Saat harga bergerak, indikator secara otomatis melacak apakah target atau stop yang terkena terlebih dahulu, memperbarui basis data internalnya, dan menyempurnakan pembacaan probabilitas di masa depan — mengubah grafik menjadi catatan yang berkembang tentang seberapa andal jebakan pembalikan ini sebenarnya.
Ini dirancang untuk para trader yang menginginkan sinyal pembalikan yang didukung oleh bukti daripada formula statis — ideal untuk melawan pergerakan kelelahan, menangkap perburuan stop, dan mengatur waktu masuk di sekitar ekstrem volatilitas di pasar dan kerangka waktu mana pun.
Ringkasan
Key features include a self-learning statistics engine that classifies each trap by market condition and tracks its outcome (target hit or stop triggered). This ongoing analysis generates a live probability score for similar setups, displayed directly on the chart to inform decision-making based on historical performance for the current instrument and timeframe.
For each detected trap, the indicator plots:
- A directional reversal signal
- A projected target level
- A protective stop level
- A live win-probability readout for that setup type
The indicator continuously updates its internal database as price action unfolds, refining future probability estimates. It supports visualization and reversal, trend strength, and level break signals, operating on bar data across any market and timeframe. This tool is suited for traders seeking evidence-based reversal signals to time entries around volatility extremes and potential stop-hunt scenarios.
Ulasan pelanggan
5 | 100 % | |
4 | 0 % | |
3 | 0 % | |
2 | 0 % | |
1 | 0 % |
Diskusi
Pertanyaan umum
Produk lain dari penulis ini
























Harga