説明
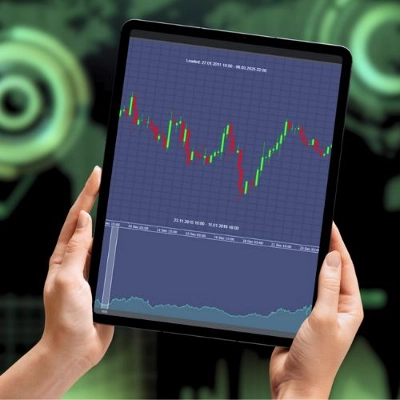
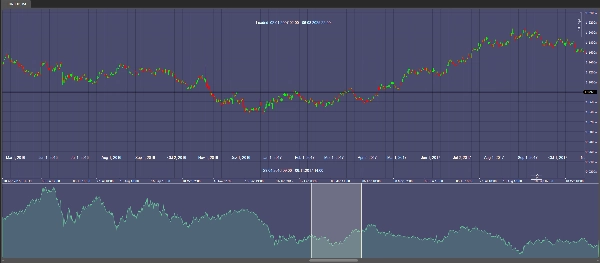
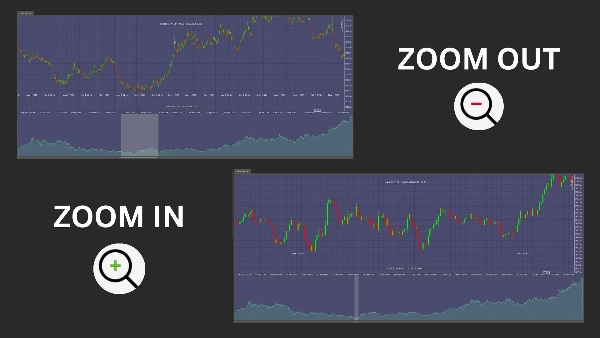
ChartOverviewは、最も古いデータポイントから最新のデータポイントまで、市場の全データ範囲を完全に把握できます。チャートの上部には、読み込まれた全期間が明確に表示され、現在表示されている期間はチャート上に直接表示されてリアルタイムの洞察を提供します。
この動的なインジケーターは、スクロール、ドラッグ、またはチャートのサイズ変更に応じてシームレスに更新され、常に最新の情報を提供します。直感的なデザインにより、市場のトレンドやチャンスを素早く特定でき、タイムリーで十分な情報に基づいた取引判断を支援します。
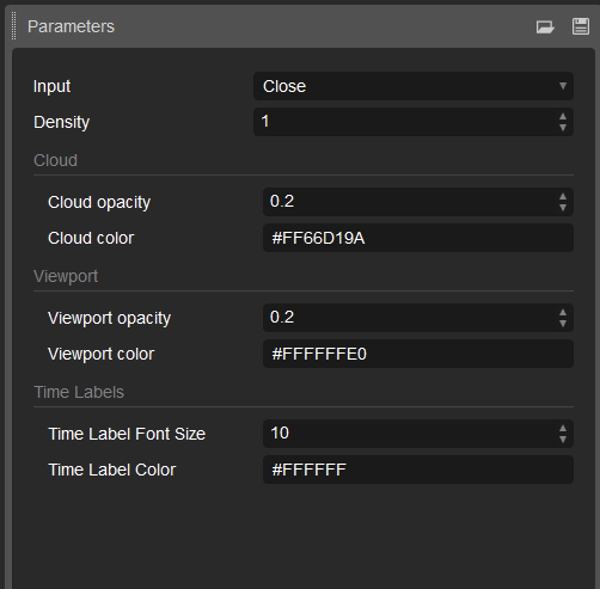
色、透明度、表示設定の幅広いカスタマイズオプションにより、ChartOverviewは個人の取引環境に完璧に統合されます。正確で包括的な市場の概要を提供するよう設計されたツールで、分析力を強化し競争優位を獲得しましょう。
概要
AIによる概要
ChartOverview is a dynamic indicator designed to provide a comprehensive snapshot of market data across the entire loaded timeframe. It displays the full range of available data at the top of the chart, while highlighting the currently visible period directly on the chart for real-time analysis. The indicator updates automatically as users scroll, drag, or resize the chart, ensuring continuous access to the latest market information. Customization options include adjustments to colors, opacity, and display settings, allowing seamless integration into various trading setups. ChartOverview supports enhanced market trend identification and timely decision-making by delivering a clear and precise overview of market activity.
インジケーターのプロフィール
カスタマーレビュー
5.0
レビュー: 1
5 | 100 % | |
4 | 0 % | |
3 | 0 % | |
2 | 0 % | |
1 | 0 % |
カスタマーレビュー
ディスカッション
よくあるご質問
cTrader Storeで入手可能な取引ボット、インジケーター、プラグインなどの商品は、第三者の開発者が提供するものであり、情報と技術の取得のみを目的としてご利用いただけます。cTrader Storeはブローカーではなく、投資助言や個人的な推奨を行うことも、将来のパフォーマンスを保証することもありません。
この作成者の他の商品
これも好きかも


価格
登録日 23/12/2024