
説明
ラウンドナンバー レベル - cTrader用インジケーター
説明
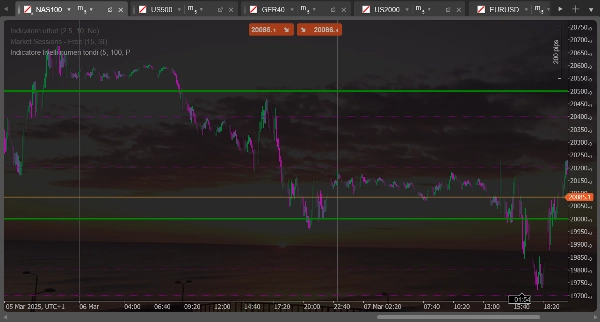
このインジケーターは、チャート上に「ラウンドナンバー」または心理的に重要なレベルの水平線を描画します。トレーダーにとって心理的に重要なことが多い丸い価格レベルに基づく潜在的なサポートおよびレジスタンスエリアを特定するのに最適です。
主な機能
- 定期的な間隔で2つの異なるセットの水平線を描画
- 現在の終値に基づいてレベルを自動計算
- 価格の動きに応じて動的に更新
- 各線セットごとに別々の設定が可能(色、スタイル、サイズ)
調整可能な設定
最初の線セット(破線)について
- ライン数セット1: 現在の価格の上下に描画するラインの数を決定します(デフォルト: 5)
- レンジサイズセット1: ライン間の距離をピップ単位で設定します(デフォルト: 100ピップ)
- ラインカラーセット1: ラインの色をカスタマイズします(デフォルト: 紫)
- ライン幅セット1: ラインの太さを設定します(デフォルト: 1ピクセル)
2番目の線セット(実線)について
- ライン数セット2: 現在の価格の上下に描画するラインの数を決定します(デフォルト: 2)
- レンジサイズセット2: ライン間の距離をピップ単位で設定します(デフォルト: 500ピップ)
- ラインカラーセット2: ラインの色をカスタマイズします(デフォルト: 緑)
- ライン幅セット2: ラインの太さを設定します(デフォルト: 1ピクセル)
実用的な使い方
通常、最初のセット(破線)は小さな心理的レベルを識別するために使用され、2番目のセット(実線)は大きな心理的レベルを強調します。例えば、EURUSDの場合、最初のセットを100ピップごとのレベル(例:1.0800、1.0900)に設定し、2番目のセットを500ピップごとのレベル(例:1.0500、1.1000)に設定することができます。
これらのレベルはしばしばサポートまたはレジスタンスゾーンと一致し、価格が反発したり動きを続ける前に減速したりする可能性があります。
Round Number Levels - Indicator for cTrader
Description
This indicator draws horizontal lines at "round numbers" or psychologically significant levels on the chart. It's ideal for identifying potential support and resistance areas based on round price levels that often have psychological importance for traders.
Main Features
- Draws two distinct sets of horizontal lines at regular intervals
- Automatically calculates levels based on the current closing price
- Updates dynamically as price moves
- Offers separate configuration for each set of lines (color, style, size)
Possible Adjustments
For the first set of lines (dashed)
- Number of Lines Set 1: Determines how many lines to draw above and below the current price (default: 5)
- Range Size Set 1: Sets the distance between lines in pips (default: 100 pips)
- Line Color Set 1: Customizes the color of the lines (default: purple)
- Line Width Set 1: Sets the thickness of the lines (default: 1 pixel)
For the second set of lines (solid)
- Number of Lines Set 2: Determines how many lines to draw above and below the current price (default: 2)
- Range Size Set 2: Sets the distance between lines in pips (default: 500 pips)
- Line Color Set 2: Customizes the color of the lines (default: green)
- Line Width Set 2: Sets the thickness of the lines (default: 1 pixel)
Practical Usage
Typically, the first set (dashed lines) is used to identify minor psychological levels, while the second set (solid lines) highlights major psychological levels. For example, for EURUSD, you might set the first set to show levels every 100 pips (such as 1.0800, 1.0900) and the second set for levels every 500 pips (such as 1.0500, 1.1000).
These levels often coincide with support or resistance zones where price might bounce or slow down before continuing its movement.
概要
カスタマーレビュー
5 | 50 % | |
4 | 50 % | |
3 | 0 % | |
2 | 0 % | |
1 | 0 % |


