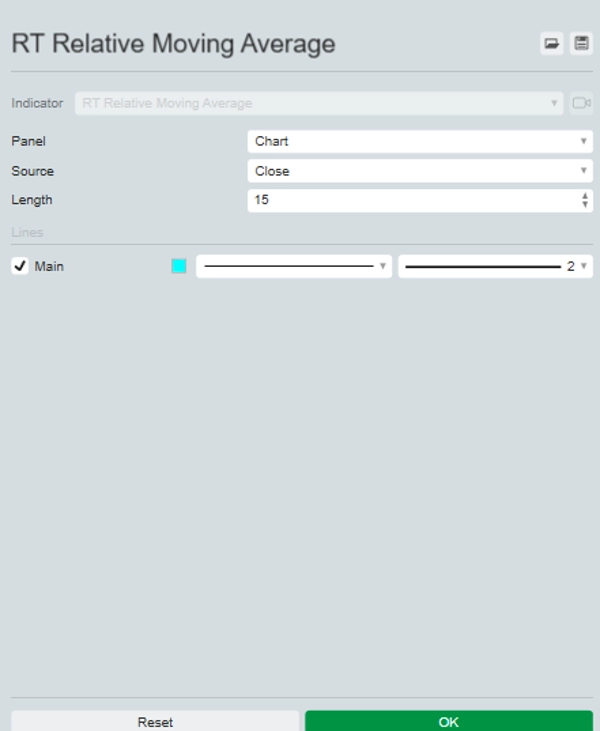
RT Relative Moving Average
Indicador
Versão 1.0, Sep 2024
Windows, Mac
Descrição
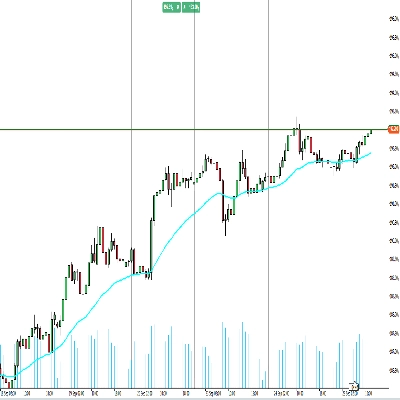
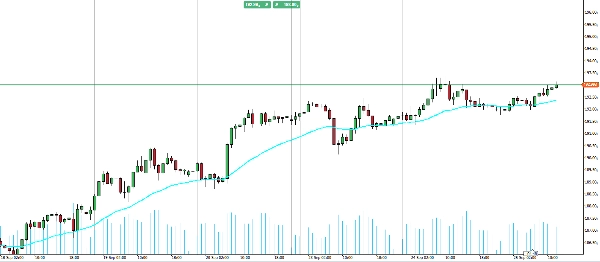
Apresentando o Relative Moving Average (RMA) indicador, agora disponível para cTrader!
Este indicador traz o RMA do TradingView para a sua plataforma de negociação. O RMA oferece uma média móvel suave e responsiva, permitindo que você identifique melhor os movimentos de preço e potenciais reversões de tendência.
O RMA reduz o atraso enquanto mantém a precisão, tornando-se uma adição inestimável ao seu conjunto de ferramentas de negociação.
Resumo
Perfil do indicador
Avaliações de clientes
0.0
Avaliações: 0
Avaliações de clientes
Ainda não há avaliações para este produto. Já o experimentou? Seja o primeiro a contar a outras pessoas!
Conversa
Perguntas frequentes
BTCUSD
Forex
Indices
EURUSD
Commodities
GBPUSD
NZDUSD
Crypto
Stocks
XAUUSD
NAS100
USDJPY
Os produtos disponíveis através da cTrader Store, incluindo bots de negociação, indicadores e plugins, são fornecidos por programadores terceiros e são disponibilizados apenas para fins informativos e de acesso técnico. A cTrader Store não é um corretor e não fornece aconselhamento em matéria de investimento, recomendações pessoais ou qualquer garantia de desempenho no futuro.


![Logótipo de "[Hamster-Coder] Pivot Points MTF"](https://cdn.ctrader.com/image/webp/4c143e5a-309c-40e3-a578-f04d1e133ffa_31159)
Preço
Desde 25/09/2024
20
Vendas