ブローカー&プロップファーム
事業者向け
00
Days
:
00
Hours
:
00
Minutes
:
00
Seconds
インジケーター
VWAP
ZigZag
RSI
FVG
ATR
Fibonacci
Supertrend
MACD
Bollinger
RSI T3 Overbought and oversold areas
02/10/2025
Desktop
登録日 11/09/2024
販売
4
無料インストール
58
「RSI T3 Overbought and oversold areas」アップロード画像

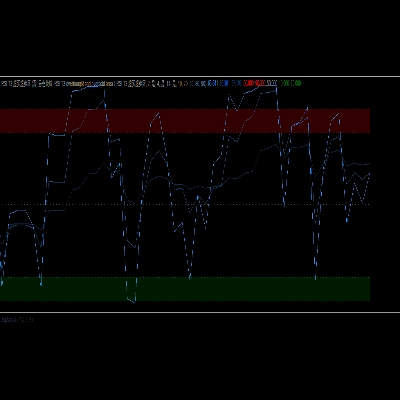
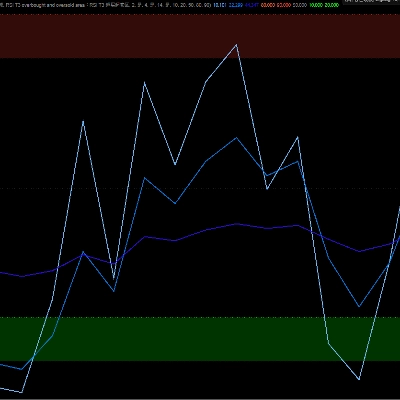
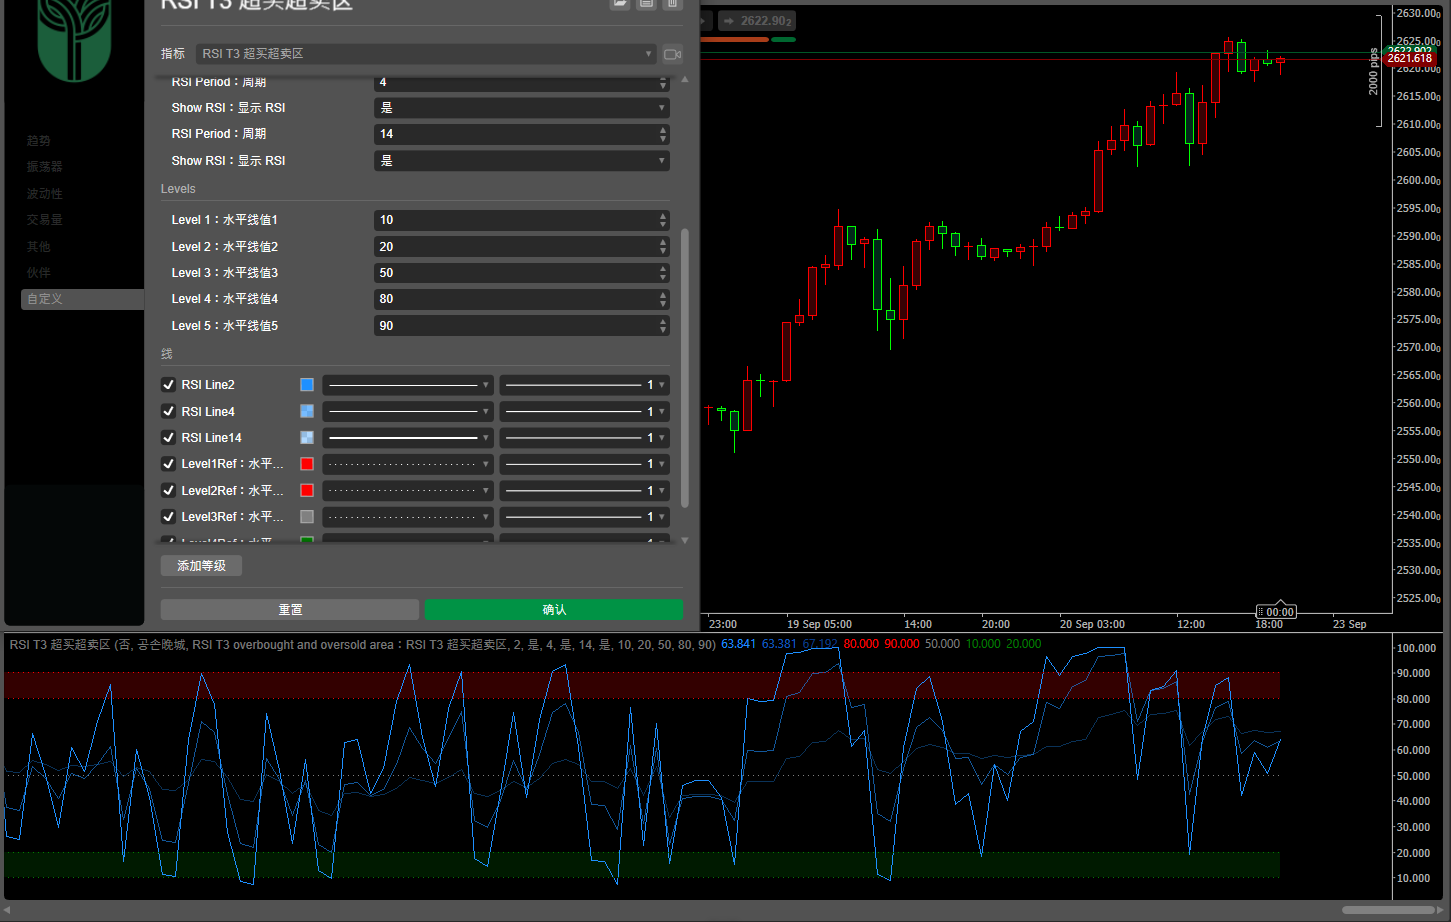
Three-Parameter RSI with Overbought/Oversold Zones
(Parameters and overbought/oversold zones can be adjusted independently; each cycle line can be turned on or off separately), facilitating the observation of multi-cycle resonance:

• Trend Consistency:
The short-, medium-, and long-cycle RSI move in the same direction. If the short-cycle RSI stays above the medium- and long-cycle RSI, it indicates a bullish trend; otherwise, it indicates a bearish trend.

• Divergence and Reversal:
When the price hits a new high/low but the short-cycle RSI fails to follow suit, and the medium- and long-cycle RSI weakens/recovers, it signals a potential pullback/rally.

• Overbought/Oversold Confirmation:
When a single-cycle RSI enters the overbought or oversold zone, judgment should be combined with other cycles; if multiple cycles enter the overbought or oversold zone simultaneously, the signal is more reliable.

• Cycle Resonance:
When multiple-cycle RSI send the same signal (e.g., all breaking through the 50 midline), the probability of the trend continuing or reversing is higher, which can assist in decision-making.


带超买超卖区域的三参数 RSI

(可自主调整参数与超买超卖区域,支持单独开关各周期线),便于观察多周期共振:


•趋势一致性:

短、中、长周期 RSI 同向运行,短周期在中长周期上方为多头趋势;反之则为空头趋势。

•背离与反转:

价格创新高 / 低但短周期 RSI 未同步,且中长周期 RSI 走弱 / 回升,提示可能回调 / 反弹。

•超买超卖确认:

单周期超买超卖时,需结合其他周期判断;多周期同时超买超卖,信号更可靠。

•周期共振:

多周期 RSI 同发信号(如均突破 50 中轴线),趋势延续或反转的概率更高,可辅助决策。

0.0
レビュー: 0
カスタマーレビュー
この商品にはまだレビューがありません。お使いになったことがある方は、ぜひレビューをお願いします。
この作成者の他の商品
Zigzag T3
Three ZigZag lines
zh-cn Variety Period clock panel(multilanguage)
This indicator can be used to: change color, shape size, position, change font, increase or decrease, and other function
インジケーター
VWAP
ZigZag
RSI
+6
RSI T3 overbought and oversold area
インジケーター
NAS100
NZDUSD
RSI
+13
Ten Thousand Functions Bands Cloud(First Edition)
A metric that can set 1 to 3 groups of Bollinger Bands
zh-cn Variety Period time panel(multilanguage)
This indicator can be used to: change color, shape size, position, change font, increase or decrease, and other function
これも好きかも
Repiptor BB Colored Width
Colored Bollinger Bands Width
インジケーター
Signal
Scalping
[Stellar Strategies] Linear Regression Candles 1.1
Approach to price analysis by visualizing candlestick data through the lens of linear regression slopes 📈📉
Time To Break Even Lite Version
This is the trial version of Time To Break Even, which help you time your trade entry.
インジケーター
Indices
Stocks
Forex
+1
Bullet Chart
✅ Unique Design. ✅ Works on All Time frames
インジケーター
Signal
Supertrend
SuperTrend Scanner
Supertrend Scanner – Track trends across assets & timeframes in real-time with alerts. Stay ahead, and trade smarter!
インジケーター
NAS100
NZDUSD
Martingale
+26
Dynamic Trendline Indicator-cBot
Trendlines That Adapt. Breakouts That Matter.
インジケーター
Grid
NAS100
Breakout
+14
Dynamic ATR TPSL R-Multiple Helper
Plot ATR-based SL and 1R/2R/3R TPs instantly for any trade, with clear R-multiple risk mapping.
Donchian Flux Cloud
Trend-coloring Donchian cloud that highlights volatility squeezes and breakouts.
インジケーター
Indices
RSI
Commodities
+1
OrderPrice-V3
A straightforward yet effective tool signals entry points for both buying and selling. Include 3 Moving Average
インジケーター
NAS100
NZDUSD
Breakout
+12
Market Profile Pro_noSourceCode
Market Profile Pro: Volume-based POC/VAH/VAL levels, configurable sessions, transparent histograms, multi-day support
インジケーター
RSI
Breakout
Supertrend
Zig-Zag Extremity Tracker
Dynamically adjusts regression channels based on ZigZag extremes, resetting when price breaks bands to track real trends
インジケーター
RSI
Breakout
XAUUSD
+7
Candle Strength Oscillator
The Candle Pressure Index is a powerful, user-friendly indicator that reveals hidden market pressure inside candles.
インジケーター
Breakout
Forex
Signal
+2
MACD Plus
A visually enhanced MACD with colored histograms to clearly show trend strength.
Cumulative Delta Candles + VolumeProfile
Cumulative delta candles + volume profile
Momentum Trend Analyzer
Provides comprehensive trend and momentum analysis by combining EMAs, RoC, normalized ATR, RSI, and volume..
Previous Day Equilibrium (Premium & Discount)
Plots the equilibrium price levels based on previous daily highs and lows.
インジケーター
NAS100
NZDUSD
XAUUSD
+10
[Stellar Strategies] VBO
Next-gen Volume Oscillator using Hyperbolic Tangent math. No repainting. Includes arrows, alerts, and overlay mode 🎯
インジケーター
NAS100
NZDUSD
Breakout
+14
Bollinger Bands Cloud
Visualize Bollinger Bands with a colored cloud for clarity. Enhance your trading precision with this dynamic indicator!