Oscilador Avanzado del Canal del Ciclo de Hurst — Descripción del Indicador
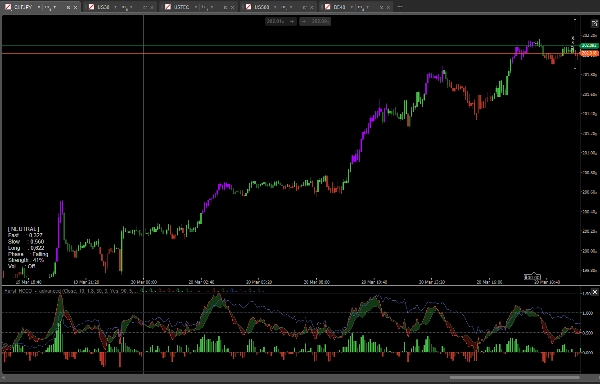
El Oscilador Avanzado del Canal del Ciclo de Hurst es un indicador profesional de momentum multicíclico para cTrader basado en los principios de la teoría del ciclo de Hurst. En lugar de medir el momentum bruto del precio, posiciona el precio actual dentro de canales de ciclo calculados dinámicamente, ofreciendo a los traders una vista normalizada de dónde se encuentra el precio dentro de su movimiento cíclico natural.
Tres Capas de Ciclo
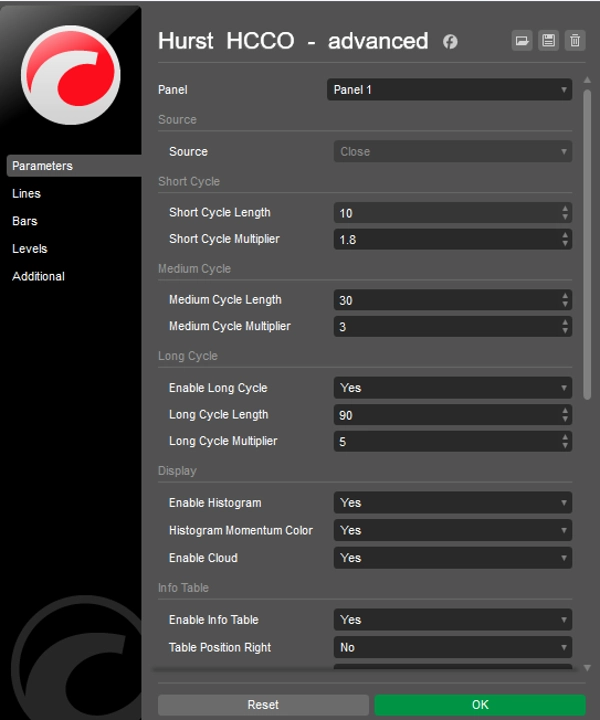
El indicador calcula tres canales de ciclo independientes — Corto, Medio y Largo — cada uno construido a partir de una media móvil exponencial centrada dentro de un sobre basado en ATR. Los ciclos Corto y Medio impulsan el oscilador principal, mientras que el ciclo Largo opcional proporciona un contexto de mercado más amplio. Todas las longitudes de ciclo y sus multiplicadores ATR son totalmente configurables.
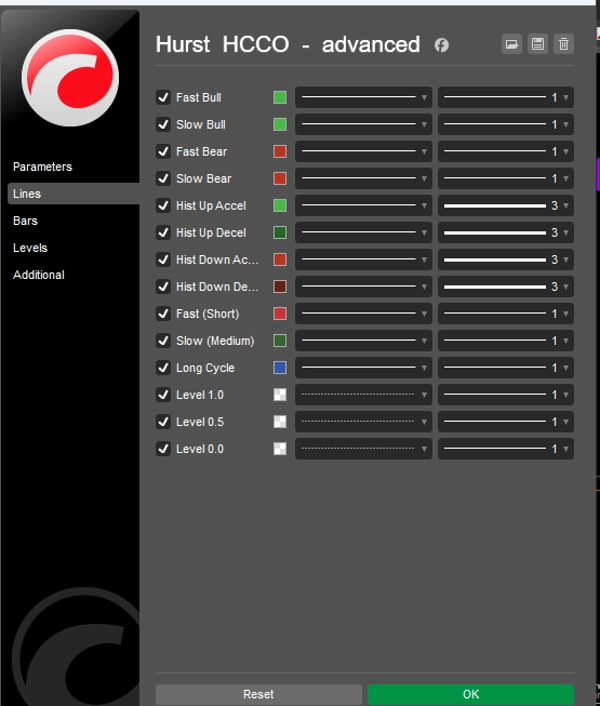
Líneas de Oscilador Rápido y Lento
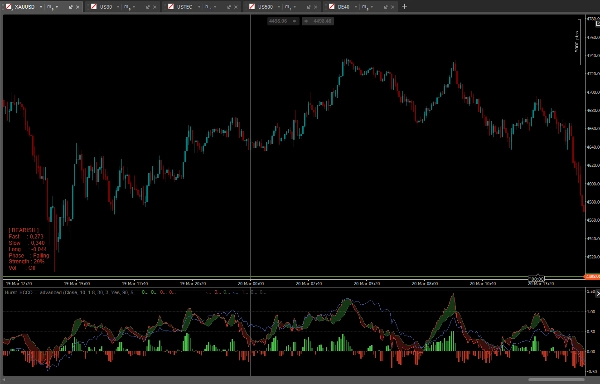
La línea Rápida muestra dónde se sitúa el precio actual dentro del canal del ciclo Medio — un valor por encima de 0.5 significa que el precio está en la mitad superior de su ciclo, por debajo de 0.5 en la mitad inferior. La línea Lenta representa el punto medio del canal del ciclo Corto en relación con el ciclo Medio, actuando como una referencia más suave. Juntas crean un oscilador de doble línea similar en estructura al MACD pero basado en la geometría del ciclo.
Nube del Ciclo
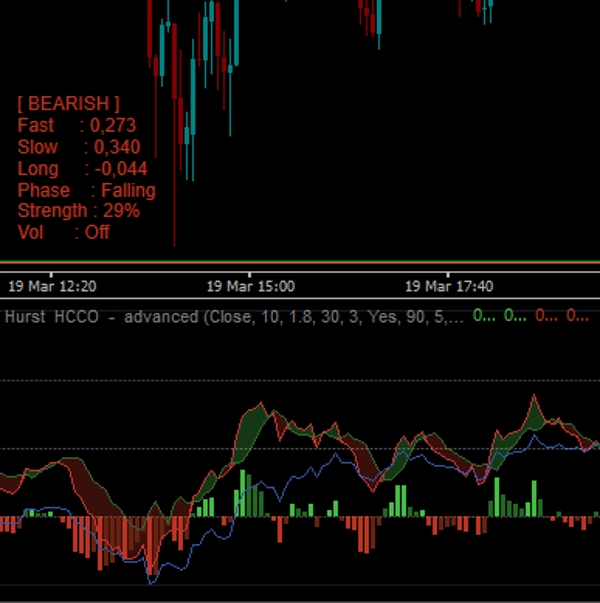
Una nube opcional llena el área entre las líneas Rápida y Lenta. Se forma una nube verde cuando la línea Rápida está por encima de la Lenta (sesgo alcista del ciclo), y una nube roja cuando la Rápida está por debajo de la Lenta (sesgo bajista del ciclo). La nube hace que la relación entre las dos capas del ciclo sea instantáneamente legible.
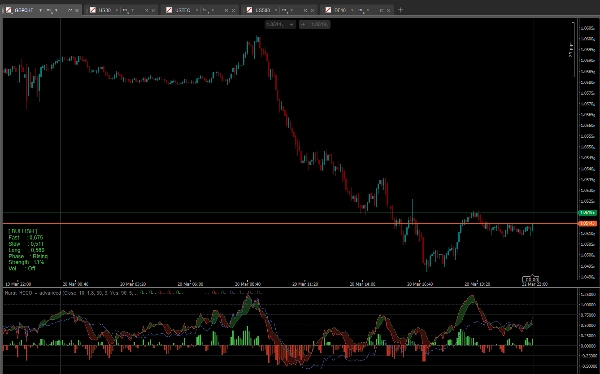
Histograma de Momentum
El histograma representa la diferencia entre las líneas Rápida y Lenta con codificación de momentum de cuatro colores — aceleración alcista, desaceleración alcista, aceleración bajista, desaceleración bajista. Esto facilita ver no solo la dirección sino si el movimiento del ciclo está ganando o perdiendo energía.
Detección de Fase del Ciclo
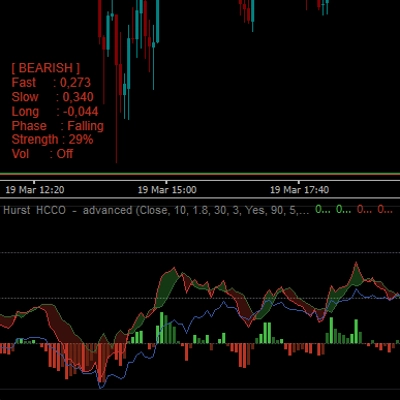
La tabla de información muestra la fase actual del ciclo: Fondo, Pre-Fondo, Recuperación, Ascenso, Debilitamiento, Post-Pico, Pico. Esta etiquetación se deriva directamente del valor del oscilador Rápido y su dirección, proporcionando a los traders una lectura en lenguaje claro de dónde está el mercado en su ciclo.
Fuerza de la Tendencia
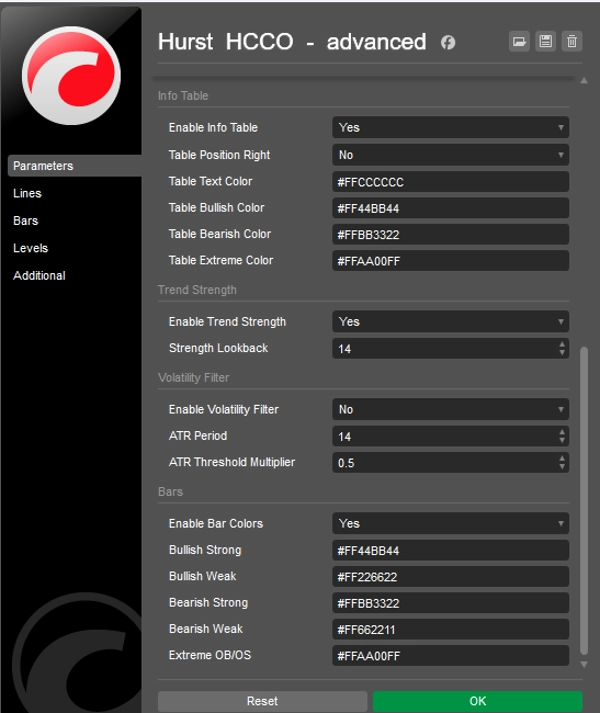
Un periodo configurable calcula una puntuación normalizada de fuerza de tendencia basada en cuánto se desvía la línea Rápida del punto medio 0.5. El resultado se muestra como un porcentaje en la tabla de información.
Filtro de Volatilidad
Un filtro de volatilidad opcional basado en ATR atenúa las barras del histograma y sus colores cuando la volatilidad del mercado cae por debajo de un umbral configurable, evitando que el oscilador genere señales engañosas durante condiciones planas o irregulares.
Tabla de Información
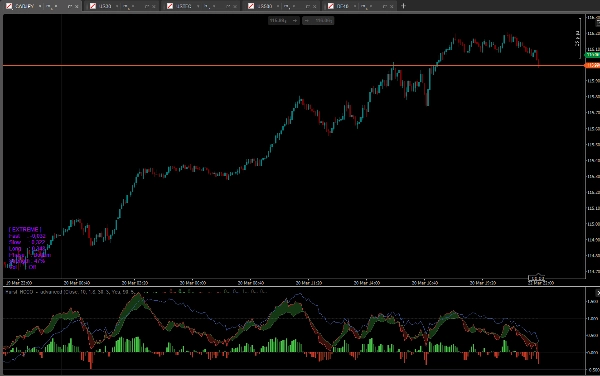
Una tabla compacta en el gráfico muestra el estado actual del mercado (Alcista, Bajista, Neutral, Extremo), los valores de los osciladores Rápido, Lento y Largo, la fase del ciclo, el porcentaje de fuerza de la tendencia y el estado del filtro de volatilidad. La posición y todos los colores son configurables.
Coloración de Barras
Cuando está habilitada, las velas del gráfico se colorean según el estado del oscilador — fuerte alcista, débil alcista, débil bajista, fuerte bajista y sobrecompra/sobreventa extrema. Las lecturas extremas ocurren cuando la línea Rápida se mueve fuera del rango 0.0–1.0, señalando una ruptura de precio más allá del canal del ciclo.
Resumen de Características Clave
- Tres capas de ciclo configurables basadas en la teoría del ciclo de Hurst
- Oscilador dual Rápido/Lento normalizado a la posición del canal del ciclo
- Nube del ciclo entre las líneas Rápida y Lenta
- Histograma de momentum de cuatro colores
- Detección automática de fase del ciclo con etiquetas en lenguaje claro
- Porcentaje de fuerza de tendencia en tiempo real
- Filtro de volatilidad basado en ATR
- Tabla de información en el gráfico con desglose completo del estado del mercado
- Coloración opcional de velas
- Todos los colores totalmente personalizables con soporte de canal alfa
- Sin repintado
5 | 100 % | |
4 | 0 % | |
3 | 0 % | |
2 | 0 % | |
1 | 0 % |


