
说明
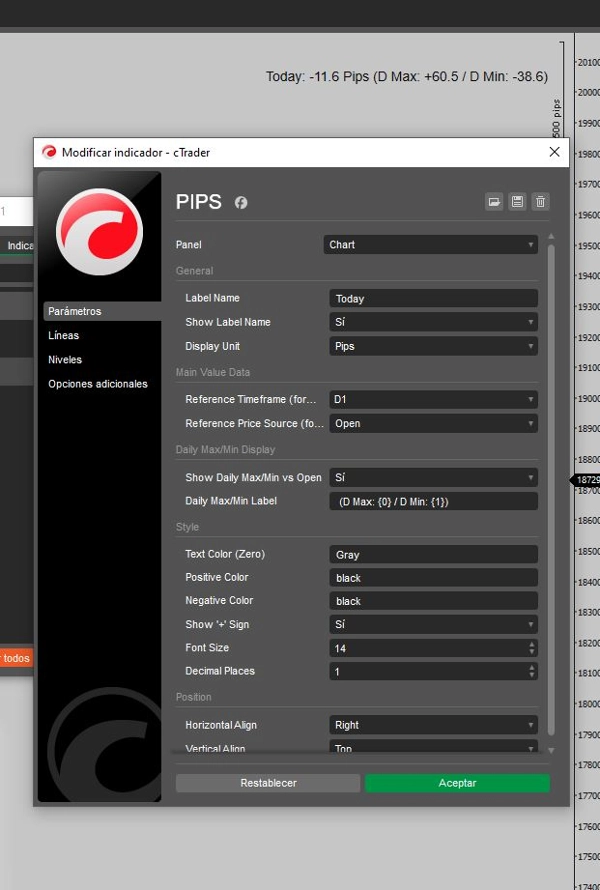
此脚本专为寻求实时分析价格走势与关键日内水平关系的交易者设计。它计算并显示当前价格与日内最高价、最低价和开盘价之间的点数距离。
主要特点:
- 实时数据: 提供当前价格与日内最高价、最低价和开盘价之间的实时点数距离。
- 视觉清晰: 提供简洁且极简的显示,消除不必要的图表杂乱。
- 多功能性: 非常适合剥头皮交易者、日内交易者和波段交易者,增强关键价格水平的决策能力。
- 高效性能: 轻量且优化以实现快速执行,确保无缝集成到您的交易工作流程中。
优势:
- 明智决策: 快速评估市场相对于关键日内水平的位置。
- 节省时间: 无需通过多个工具即可即时访问重要价格数据。
- 可定制: 适合寻求个性化且不干扰的价格水平跟踪方式的交易者。
摘要
AI 摘要
Pips V4Final is a trading indicator that provides real-time analysis of price action relative to key daily levels. It calculates and displays the pip distance between the current price and the daily high, low, and open directly on the chart. The indicator features a clean, minimalist interface designed to reduce chart clutter, making it suitable for scalpers, day traders, and swing traders. It is lightweight and optimized for fast execution, allowing seamless integration into various trading workflows. Users can quickly assess market positioning at critical price points, saving time by accessing essential price data instantly. The tool is customizable, offering a non-intrusive way to monitor important daily price levels for informed decision-making.
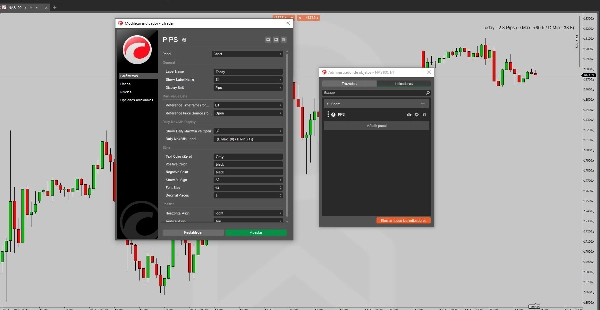
指标配置
客户评价
4.5
评价:2
5 | 50 % | |
4 | 50 % | |
3 | 0 % | |
2 | 0 % | |
1 | 0 % |
讨论
常见问答
cTrader Store 提供的所有产品,包括交易机器人、指标和插件,均由第三方开发者提供,仅供信息参考和技术访问之用。cTrader Store 并非经纪商,不提供投资建议、个人推荐或任何未来业绩保证。


猜您喜欢


价格
注册日期 13/01/2025
2
销售