
설명
이 지표는 차트에서 "Fade Breakout"이라는 반대 전략의 거래 논리를 시각화하는 도구입니다. 실제 거래를 수행하지는 않지만 신호가 발생했을 때 진입부터 청산까지 포지션이 어떻게 관리되는지를 보여줍니다.
주요 기능
- 진입 신호:
-
- 이 지표는 Donchian Channel을 활용합니다.
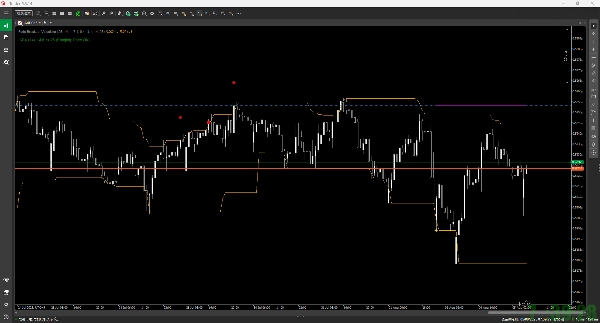
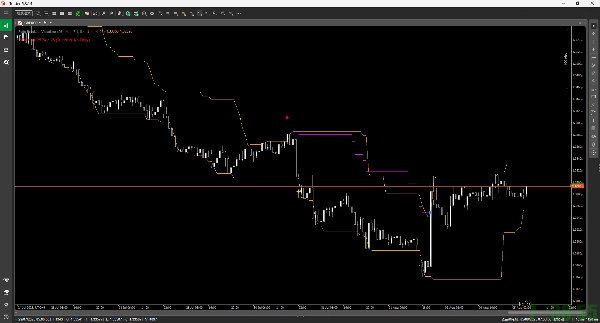
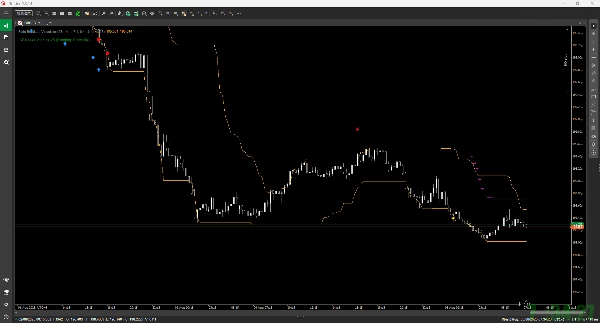
- 매수 신호 (반대 전략): 가격이 하단 Donchian Channel 밴드를 하향 돌파할 때, 매수 신호(파란색 위쪽 화살표 ↑)를 표시합니다.
- 매도 신호 (반대 전략): 가격이 상단 Donchian Channel 밴드를 상향 돌파할 때, 매도 신호(빨간색 아래쪽 화살표 ↓)를 표시합니다.
- 위험 관리:
-
- 진입 시, 초기 손절선(빨간 점선)과 첫 번째 이익 실현선(초록 점선)이 ATR (Average True Range)를 기준으로 그려집니다.
- 첫 번째 이익 실현(TP1)에 도달하면 금색 별(★)이 나타나고, 손절선은 진입 가격(손익분기점)으로 이동합니다.
- 그 후, ATR 기반의 추적 손절매가 활성화되어 가격을 따라가며 이익을 보호합니다. 추적 손절매 경로는 자주색 선으로 표시됩니다.
- 거래 청산:
-
- 손절매: 가격이 손절매 수준에 도달하면 빨간색 사각형(■)으로 표시됩니다.
- 추적 손절매 청산: 가격이 추적 손절매에 도달하면 파란색 사각형(■)으로 표시됩니다.
- ADX 필터:
-
- 선택적으로 ADX 필터를 활성화할 수 있습니다.
- ADX가 지정된 값보다 높으면(강한 추세를 나타냄) 새로운 진입 신호가 비활성화됩니다. 현재 상태(진입 가능 / 진입 불가)는 차트 왼쪽 상단의 텍스트에 표시됩니다.
요약
지표 프로필
고객 리뷰
0.0
리뷰: 0
고객 리뷰
이 상품에 대한 리뷰가 아직 없습니다. 이미 사용해 보셨나요? 다른 사람들에게 가장 먼저 소개해 주세요!
상담
자주 묻는 질문(FAQ)
트레이딩 봇, 지표, 플러그인 등 cTrader Store에서 제공되는 상품은 제3자 개발자에 의해 제공되며, 이는 단순히 정보 및 기술적 접근을 목적으로 제공된 것입니다. cTrader Store는 중개인이 아니며, 투자 조언, 개인별 추천 또는 향후 성과에 대한 어떠한 보장도 제공하지 않습니다.
이 작성자의 상품 더 보기


가격
1
판매
1.34K
무료 설치