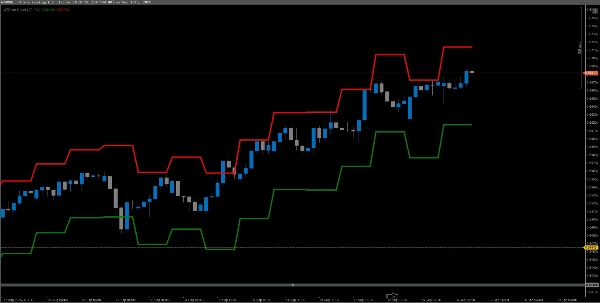
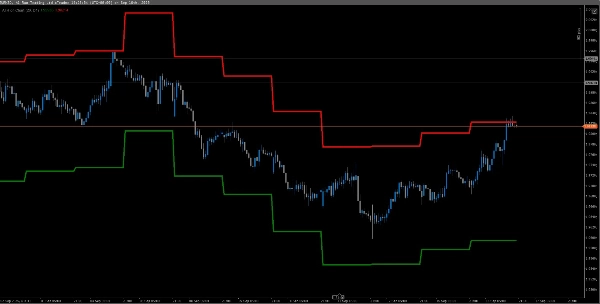
지표
Indices
XAUUSD
ATR
Commodities
Forex
Signal
EURUSD
GBPUSD
Crypto
BTCUSD
USDJPY
ATR on Chart
"ATR on Chart" 로고
16/09/2025
61
Desktop
가입일 11/09/2025
무료 설치
61
"ATR on Chart" 업로드된 이미지"ATR on Chart" 업로드된 이미지

Shows the average true range. Plots the ATR on the chart for easy visualization, default time frame is the Daily but you can alter it.

0.0
리뷰: 0
고객 리뷰
이 상품에 대한 리뷰가 아직 없습니다. 이미 사용해 보셨나요? 다른 사람들에게 가장 먼저 소개해 주세요!
좋아하실 만한 다른 항목
Volume Profile Fixed Range
Professional Volume Profile Indicator - Shows volume distribution, POC, Value Areas & Buy/Sell pressure.
지표
Signal
MACD
USDJPY
PulseTracker
Version 1.2: Advanced Trend Detection & Visualization System
Previous Day Liquidity Zones (PDH - PDL)
Useful indicator for traders who want to visualize key price levels based on previous daily highs and lows.
Advanced Market Structure Bos,Choch,SwinLevels, Order Blog
Advanced price action tool that combines multiple technical analysis concepts
지표
NAS100
NZDUSD
XAUUSD
+11
Support and Resistance Lite
🟢 Real swing-based support & resistance with ATR-powered half-bands 🔴
지표
NAS100
NZDUSD
Breakout
+12
Supertrend - Multi-Timeframe
Supertrend - Multi-Timeframe Indicator
지표
RSI
Breakout
XAUUSD
+4
Multi-Level Candle Bias Tracker
Price direction by calculating the probability of reaching new highs/lows. Shows levels & stats📈
지표
NAS100
Indices
XAUUSD
+4
PrevDayProjection
Automatically calculates the previous day’s high and low, determines the range, and then projects Fibonacci levels.
지표
Indices
XAUUSD
Commodities
+5
cAlgoBuddy - Chaos Reversals
The cTrader Chaos Reversals indicator brings high-quality reversal signals to traders.
지표
Prop
Commodities
Stocks
+2
Light-Version BrickAlgo TrendPulse
🚀 Simplify Your Trading Decisions With Powerful Technical Analysis.
지표
NAS100
NZDUSD
RSI
+12
TrendFibonacci
The TrendFibonacci indicator is a powerful tool for traders, combining Fibonacci retracement levels
지표
Forex
VegaXLR - Fibonacci Bands
Customizable Dynamic Fibonacci Channels and Smart Alerts
Range 10 Rsi
RSI Scalping cBot: quick‑fire trades on choppy symbols.
trPDHLC
this indicator shows previous day high low and closed with precise manner.
지표
Indices
RSI
Commodities
+1
OrderPrice-V3
A straightforward yet effective tool signals entry points for both buying and selling. Include 3 Moving Average
지표
NZDUSD
XAUUSD
Commodities
+3
AlgoCorner Correlations Map
Check the correlations between dozens of assets in one elegant display.
지표
Grid
NAS100
NZDUSD
+17
Institutional Volume Supply Demand
Volume Profile Supply Demand
Daily Open Pivot Level
This indicator is a valuable tool for traders looking to identify significant opening price level of any asset.