คำอธิบาย
เมื่อดูที่ตัวบ่งชี้เต็มรูปแบบ ให้ฉันเขียนคำอธิบายสั้น ๆ และรายการร้านค้าเต็มรูปแบบ
คำอธิบายสั้น ๆ (120 ตัวอักษร)
HTF Bias Detector: แผงเทียน, รูปแบบ CRT/Expansion/Swing Point, ความเบี่ยงเบน PSP & SMT — ทั้งหมดในโอเวอร์เลย์เดียว
คำอธิบายร้านค้า cTrader ฉบับเต็ม
HTF Bias Detector — ฉบับแผง
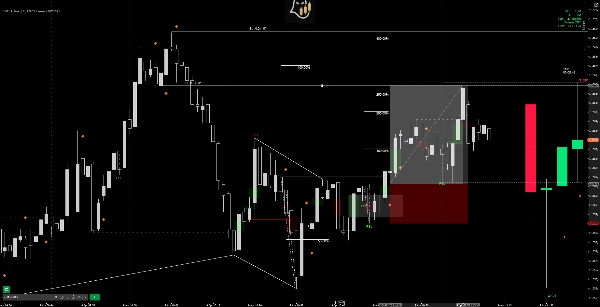
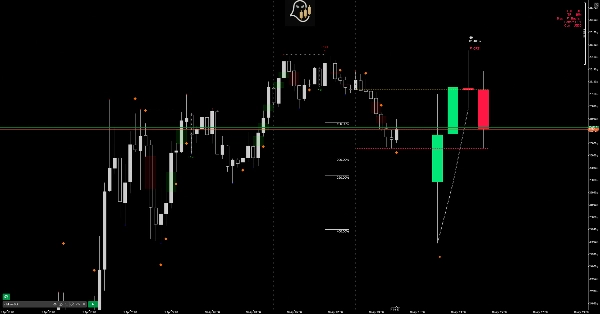
HTF Bias Detector นำกระบวนการวิเคราะห์แบบ top-down ทั้งหมดของคุณมาไว้ในตัวบ่งชี้โอเวอร์เลย์เดียว แทนที่จะสลับไปมาระหว่างกรอบเวลาต่าง ๆ มันจะวาดแผงลอยของเทียน Higher Timeframe (HTF) โดยตรงทางขวาของราคาบนแผนภูมิปัจจุบันของคุณ จากนั้นจะตรวจจับรูปแบบอคติหลักของคุณ ความเบี่ยงเบนคู่สหสัมพันธ์ และสัญญาณเทคนิค Smart Money — ทั้งหมดโดยไม่ต้องออกจากหน้าจอ
วิธีการทำงานของแผง
ตัวบ่งชี้จะกำหนด HTF ที่ถูกต้องโดยอัตโนมัติตามแผนภูมิที่คุณใช้อยู่ โดยปฏิบัติตามการจัดกรอบเวลามาตรฐานที่ใช้ในสถาบันและการซื้อขาย Smart Money:
แผง ChartHTF ของคุณ
1M / 2M / 3M / 4M - 15M
5M / 10M - 1H
15M / 30M - 4H
1H - Daily
4H - Weekly
Daily - Monthly
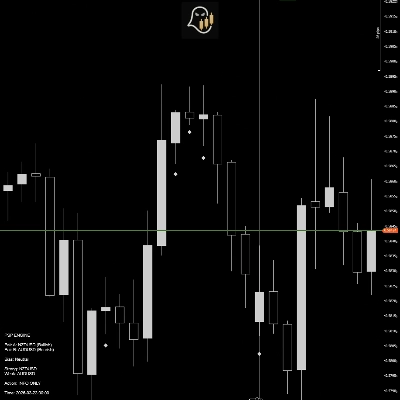
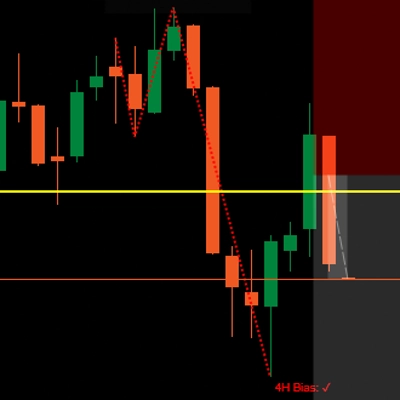
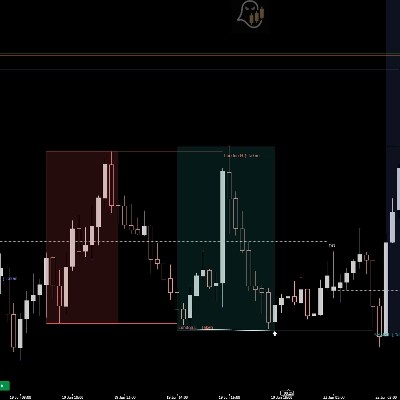
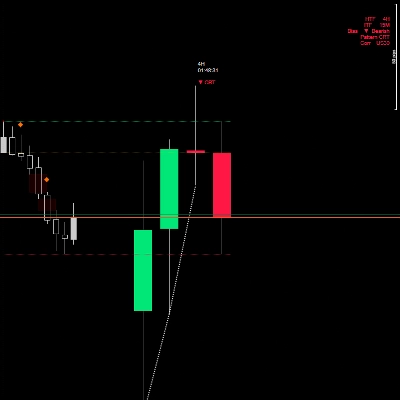
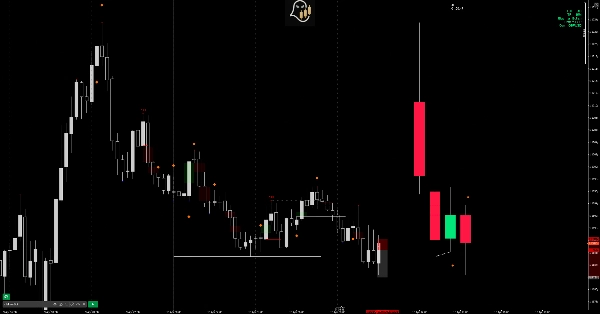
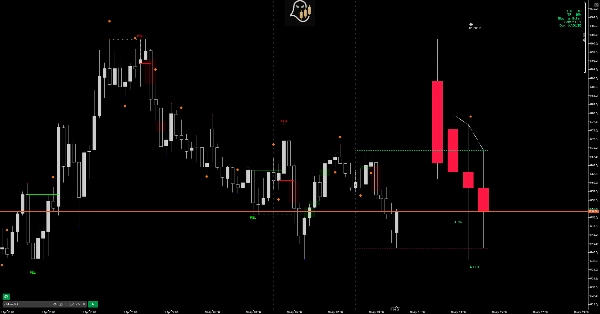
แผงจะวาดเทียน HTF ที่กำหนดค่าได้ N แท่ง (ค่าเริ่มต้น 6) ทางขวาของแท่งสุดท้าย พร้อมกล่องพื้นหลัง ไส้เทียนที่จัดกึ่งกลางบนตัวเทียนแต่ละแท่ง และเส้นแบ่งจุดแนวตั้งบนแผนภูมิสดที่ทำเครื่องหมายการเปิด HTF แต่ละแท่ง ตัวจับเวลานับถอยหลังเหนือแผงแสดงเวลาที่เหลือในเทียน HTF ปัจจุบัน และเส้นโปรเจกชัน OHLC แบบขีดเส้นประจะยืดออกจากเทียน HTF ที่กำลังก่อตัวกลับไปยังพื้นที่ราคาสดเพื่อให้คุณรู้เสมอว่าการเปิด HTF ปัจจุบัน สูง ต่ำ และปิดอยู่ที่ใด
การตรวจจับรูปแบบอคติ
ตัวบ่งชี้จะสแกนเทียนแผง HTF ที่มองเห็นได้เพื่อหารูปแบบอคติสถาบันหลักสามรูปแบบและติดป้ายสัญญาณที่ตรวจพบแต่ละรายการโดยตรงบนแผง:
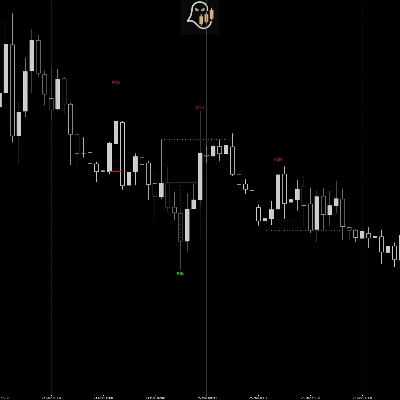
CRT — ทฤษฎีช่วงเทียน ก่อตัวโดยเทียนสองแท่ง C1 กำหนดช่วง C2 กวาดต่ำของ C1 (กระทิง) หรือสูงของ C1 (หมี) แต่ปิดกลับภายในช่วงโดยไม่ถึงขอบเขตตรงข้าม สัญญาณการจับสภาพคล่องและการขยายตัวในทิศทางตรงกันข้าม C3 และ C4 เป็นเทียนขยายที่คาดหวัง
Expansion ก่อตัวโดยเทียนสองแท่ง C2 กวาดต่ำของ C1 แล้วปิดเหนือสูงของ C1 (กระทิง) หรือกวาดสูงของ C1 แล้วปิดต่ำกว่าต่ำของ C1 (หมี) การขยายเต็มช่วงของเทียนแท่งเดียวแสดงแรงกดดันทิศทางที่ล้นหลาม C3 และ C4 เป็นเทียนต่อเนื่องที่คาดหวัง
Swing Point (Protected) ก่อตัวโดยเทียนสามแท่ง C1 กำหนดทิศทาง C2 ทำลายและปิดเกินขอบเขตของ C1 — ดักจับเทรดเดอร์ที่เบรคเอาต์ C3 ฟื้นฟูช่วงของ C2 โดยปิดเหนือเปิดของ C2 (กระทิง) หรือใต้เปิดของ C2 (หมี) ปกป้องสวิงและสัญญาณกลับตัว C4 เป็นการต่อเนื่องที่คาดหวัง
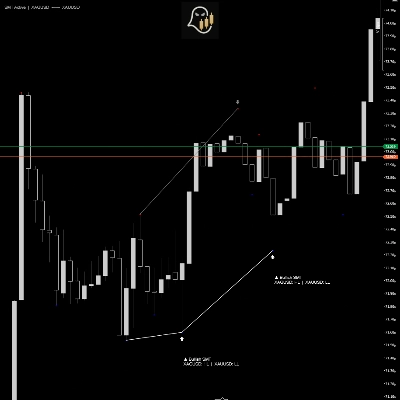
แต่ละรูปแบบที่ตรวจพบจะติดป้ายด้วยลูกศรทิศทางและชื่อรูปแบบโดยตรงบนเทียนสัญญาณในแผง (เช่น ▲ CRT, ▼ Expansion, ▲ Swing Point) ระบบแผนที่สีรับประกันว่าเมื่อรูปแบบหลายรูปแบบทับซ้อนกันบนเทียนเดียวกัน รูปแบบล่าสุดจะชนะเสมอ — ป้องกันไม่ให้สีเก่าจากสัญญาณก่อนหน้าปนเปื้อนสัญญาณใหม่
PSP — Precision Swing Point
PSP ถูกตรวจจับที่สองระดับพร้อมกัน:
HTF Panel PSP — เปรียบเทียบเทียนแผง HTF แต่ละแท่งของสัญลักษณ์แผนภูมิของคุณกับเทียนที่สอดคล้องกันของคู่สหสัมพันธ์ในกรอบเวลาเดียวกัน เมื่อทั้งสองคู่ปิดในทิศทางตรงกันข้ามบนเทียน HTF เดียวกัน จะมีสัญลักษณ์ ◆ สีส้มปรากฏเหนือหรือใต้เทียนแผงนั้น เลื่อนออกไปเล็กน้อยเกินป้ายรูปแบบเพื่อให้ทั้งสองสัญญาณอ่านได้โดยไม่ทับซ้อนกัน
ITF Chart PSP — สแกนแท่งล่าสุด 200 แท่งของกรอบเวลาปัจจุบันของแผนภูมิและวางไอคอน ◆ สีส้มโดยตรงบนแต่ละแท่งที่สัญลักษณ์ของคุณและคู่สหสัมพันธ์ปิดในทิศทางตรงกันข้าม ตัวกรองโดจิที่กำหนดค่าได้ (ค่าเริ่มต้น 10% อัตราส่วนตัวเทียนต่อช่วง) ป้องกันเทียน indecision อ่อนแอจากการสร้างสัญญาณ PSP เท็จ
SMT — ความเบี่ยงเบนเทคนิค Smart Money
ความเบี่ยงเบน SMT ถูกตรวจจับที่สองระดับ:
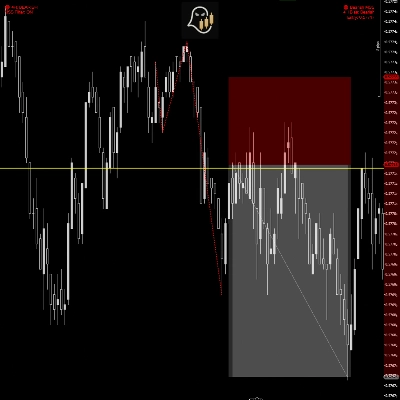
HTF Panel SMT — เปรียบเทียบสูงสุดและต่ำสุดของเทียนแผง HTF ติดต่อกันระหว่างสัญลักษณ์แผนภูมิของคุณ (คู่ A) และคู่สหสัมพันธ์ (คู่ B) เมื่อคู่ A ทำจุดต่ำสุดต่ำกว่าในขณะที่คู่ B ทำจุดต่ำสุดสูงกว่า (SMT กระทิง) หรือคู่ A ทำจุดสูงสุดสูงกว่าในขณะที่คู่ B ทำจุดสูงสุดต่ำกว่า (SMT หมี) จะมีเส้นสองเส้นวาดโดยตรงในแผงเชื่อมต่อระดับราคาที่เบี่ยงเบน
รูปแบบเส้นสื่อสารว่าด้านใดของความเบี่ยงเบนที่แผนภูมิปัจจุบันของคุณเป็นตัวแทน: เส้นทึบหมายถึงด้านที่ถูกกวาด/ปลอม และเส้นประหมายถึงด้านที่แข็งแกร่ง/ได้รับการปกป้อง เนื่องจากการตรวจจับเป็นแบบสมมาตร สัญญาณจะปรากฏบนแผนภูมิ GBPUSD และ EURUSD (ตัวอย่าง) พร้อมกัน — โดยเส้นทึบและเส้นประสลับกันขึ้นอยู่กับว่าคุณกำลังดูคู่ใด
การตรวจจับคู่สหสัมพันธ์อัตโนมัติ
ตัวบ่งชี้จะระบุคู่สหสัมพันธ์จากสัญลักษณ์แผนภูมิโดยอัตโนมัติ โดยใช้แผนที่คู่ที่ครอบคลุมคู่ฟอเร็กซ์หลัก โลหะ ดัชนี และคริปโต ไม่จำเป็นต้องตั้งค่าด้วยตนเองสำหรับคู่ที่คุณเทรดบ่อยที่สุด:
สัญลักษณ์ คู่สหสัมพันธ์อัตโนมัติ
GBPUSD-EURUSD
AUDUSD-NZDUSD
GBPJPY-EURJPY
XAUUSD-XAGUSD
NAS100-US30
US500-NAS100
BTCUSD-ETHUSD
ตัวแก้ไขจะทำให้ชื่อสัญลักษณ์เป็นมาตรฐาน (ลบตัวคั่นเช่น /, -, _) และตัดคำต่อท้ายโบรกเกอร์ทั่วไป (เช่น GBPUSDm, GBPUSD.r, GBPUSD_SB) ก่อนการค้นหา พารามิเตอร์ Manual Symbol Override ช่วยให้คุณระบุคู่สหสัมพันธ์ที่กำหนดเองได้ และสวิตช์ Auto-Detect ช่วยให้คุณปิดการแก้ไขอัตโนมัติทั้งหมดได้
แดชบอร์ด
แดชบอร์ดมุมกะทัดรัด (กำหนดตำแหน่งได้ทุกมุม) แสดง:
- HTF — กรอบเวลาของเทียนแผง
- ITF — กรอบเวลาปัจจุบันของแผนภูมิของคุณ
- Bias — ▲ กระทิง / ▼ หมี / ── เป็นกลางตามรูปแบบที่ตรวจพบล่าสุด
- Pattern — ชื่อรูปแบบเฉพาะ (CRT, Expansion, Swing Point, PSP)
- Corr — สัญลักษณ์สหสัมพันธ์ที่แก้ไขแล้ว
สีข้อความแดชบอร์ดตรงกับทิศทางอคติ — สีเขียวสำหรับกระทิง สีแดงสำหรับหมี สีเทาสำหรับเป็นกลาง
การวาดอย่างปลอดภัย — เส้นของคุณจะไม่ถูกลบ
วัตถุของตัวบ่งชี้ทั้งหมดใช้คำนำหน้าภายในเฉพาะ วัตถุของตัวบ่งชี้เองเท่านั้นที่จะถูกลบในการวาดซ้ำแต่ละครั้ง เส้นแนวโน้มที่คุณวาดด้วยตนเอง สี่เหลี่ยม ระดับฟีโบนักชี และวัตถุเครื่องมือวาดอื่น ๆ จะไม่ถูกแตะต้องเลย
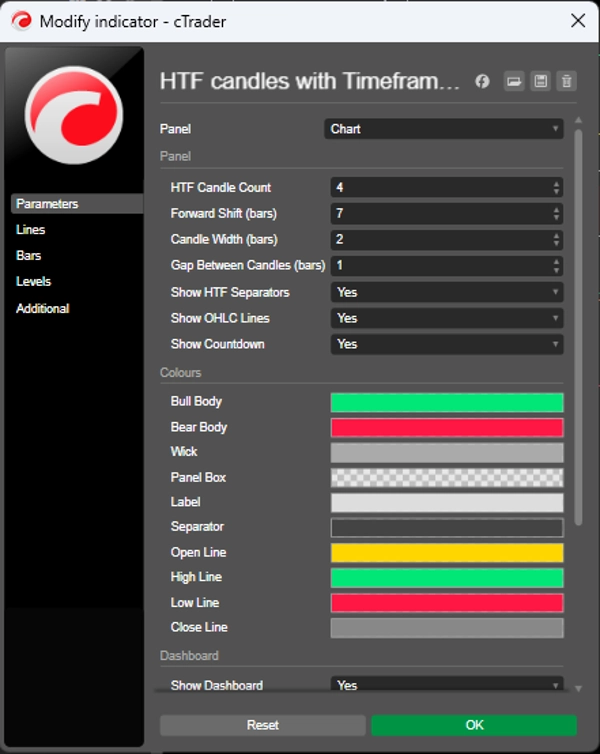
กลุ่มพารามิเตอร์
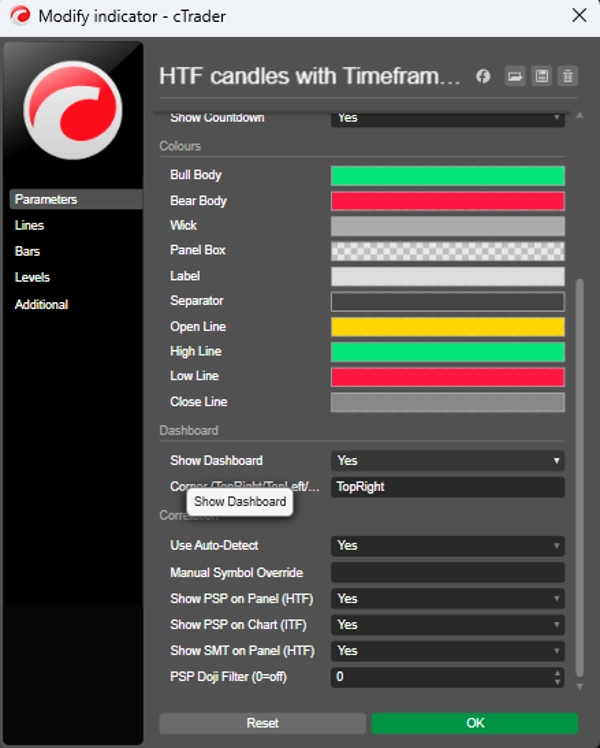
Panel — จำนวนเทียน, การเลื่อนล่วงหน้า, ความกว้างเทียน, ช่องว่าง, ตัวแบ่ง, เส้น OHLC, ตัวจับเวลานับถอยหลัง
Colours — ตัวเทียนกระทิง, ตัวเทียนหมี, ไส้เทียน, กล่องแผง, ป้าย, ตัวแบ่ง, สีเส้นเปิด/สูง/ต่ำ/ปิด
Dashboard — สวิตช์แสดง, ตำแหน่งมุม
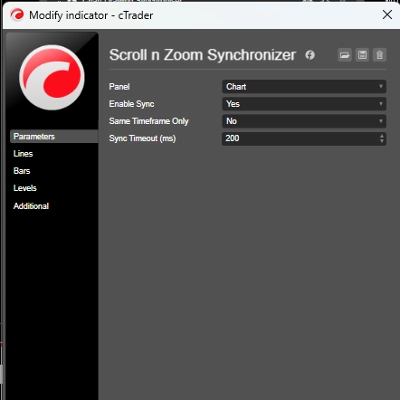
Correlation — สวิตช์ตรวจจับอัตโนมัติ, การแทนที่สัญลักษณ์ด้วยตนเอง, สวิตช์ PSP แผง, สวิตช์ PSP แผนภูมิ, สวิตช์ HTF SMT, ตัวกรองโดจิ PSP
ITF SMT — สวิตช์แสดง, การย้อนกลับสวิง, จำนวนแท่งขั้นต่ำระหว่างสวิง, สวิตช์หมี/กระทิง, ความหนาเส้น, สวิตช์ป้าย