

present
Sign up and get $50 off your first purchase
Trading product for Smart Liquidity Matrix Indicator Premium/Discount  Fair Value Gap, image 1
Smart Liquidity Matrix
Indicator
Version 1.0, Sep 2026
Windows, Mac
Trading product for Smart Liquidity Matrix Indicator Premium/Discount  Fair Value Gap, image 2
Trading product for Smart Liquidity Matrix Indicator Premium/Discount  Fair Value Gap, image 3
Trading product for Smart Liquidity Matrix Indicator Premium/Discount  Fair Value Gap, image 4
Trading product for Smart Liquidity Matrix Indicator Premium/Discount  Fair Value Gap, image 5
Trading product for Smart Liquidity Matrix Indicator Premium/Discount  Fair Value Gap, image 6
Trading product for Smart Liquidity Matrix Indicator Premium/Discount  Fair Value Gap, image 7
Trading product for Smart Liquidity Matrix Indicator Premium/Discount  Fair Value Gap, image 8
Trading product for Smart Liquidity Matrix Indicator Premium/Discount  Fair Value Gap, image 9
Trading product for Smart Liquidity Matrix Indicator Premium/Discount  Fair Value Gap, image 10
Trading product for Smart Liquidity Matrix Indicator Premium/Discount  Fair Value Gap, image 11

Description

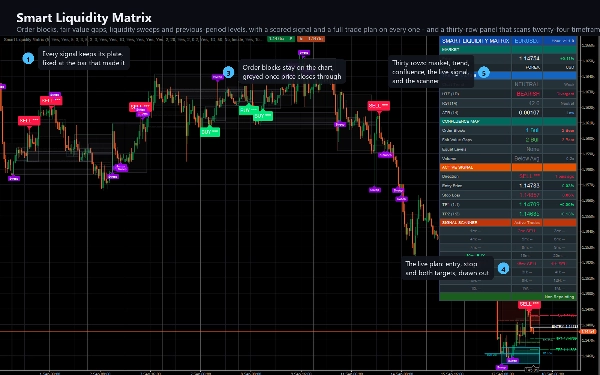
Smart Liquidity Matrix marks the structure that institutional order flow leaves behind, and keeps a

running read of the same setup across twenty four timeframes at once.


WHAT IT DRAWS


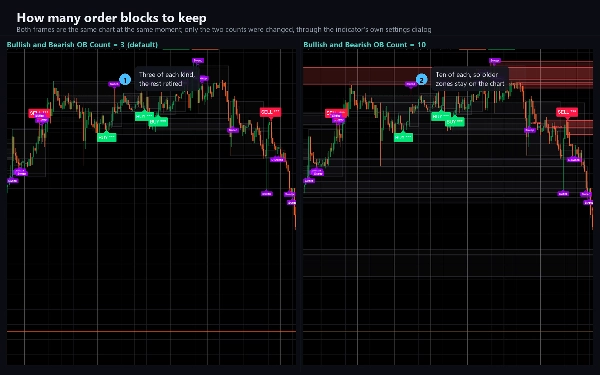
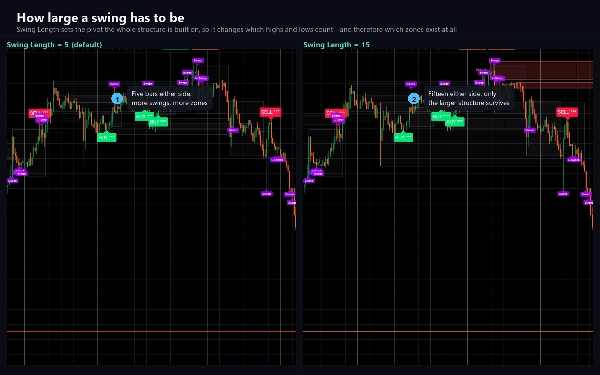
Order blocks. At every confirmed swing, the last opposite candle before the move is boxed. The zone

stays live until price closes through it, then greys out rather than disappearing, so you can still

see where it was.


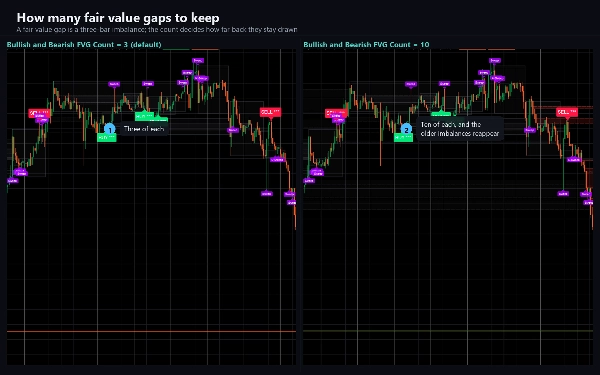
Fair value gaps. Three-bar imbalances, drawn the moment they form and greyed when price closes back

through them.


Equal highs and lows. Swings that match within a tenth of the current ATR are joined with a dotted

level and tagged EQH or EQL. These are the pools that liquidity sweeps hunt.


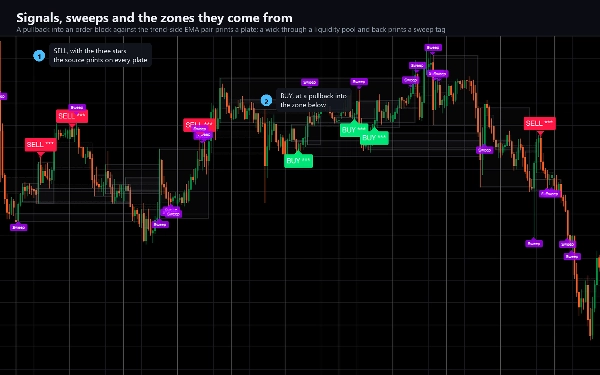
Liquidity sweeps. When price wicks through an equal level or the previous period high or low and

closes back inside, the bar is marked. Each sweep can raise an alert.


Previous period levels and equilibrium. The previous day high and low, drawn with their own glow,

plus the fifty percent line between the current swing high and low.


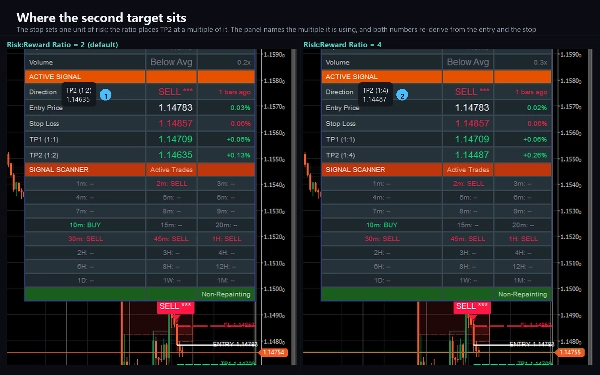
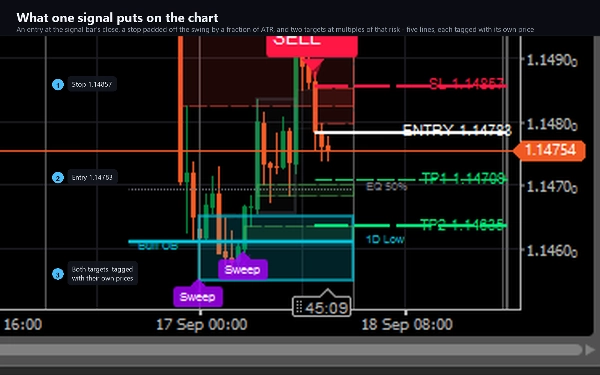
Buy and sell signals with a risk picture. A pullback entry against the trend-side EMA pair, with the

entry, stop and two targets drawn out to the right of the bar and labelled with their prices.


THE SCANNER


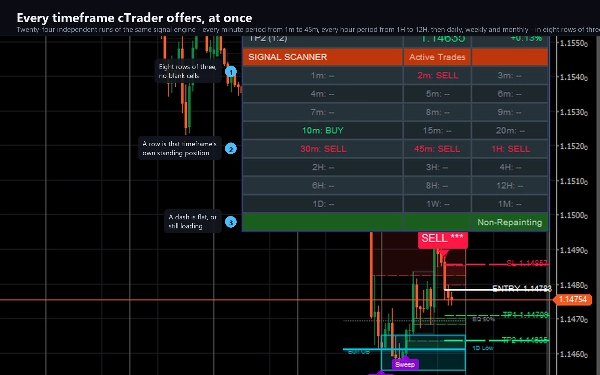
The lower third of the dashboard runs the same signal logic on twenty four timeframes

independently, from one minute to one month, and prints whether each one currently holds a long, a

short, or nothing. Agreement across neighbouring rows is the point: a sell showing on thirty minutes,

forty five minutes and one hour together reads very differently from a lone signal on a single row.


Those twenty four are every standard time period cTrader offers: one, two, three, four, five, six,

seven, eight, nine, ten, fifteen, twenty, thirty and forty five minutes, then one, two, three, four,

six, eight and twelve hours, then daily, weekly and monthly. Every one is read from the same bar data

as the chart, so nothing here depends on your broker tick history, and they fill eight rows of three

exactly with no empty cells.


THE DASHBOARD


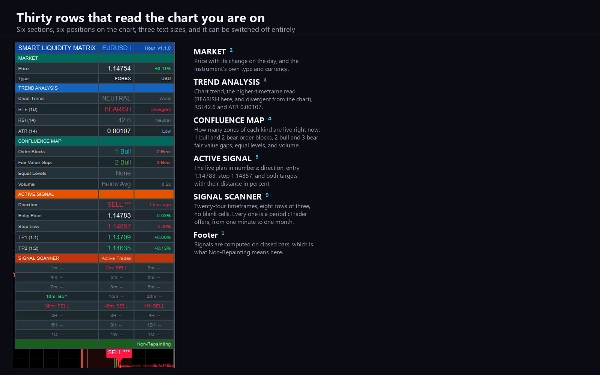
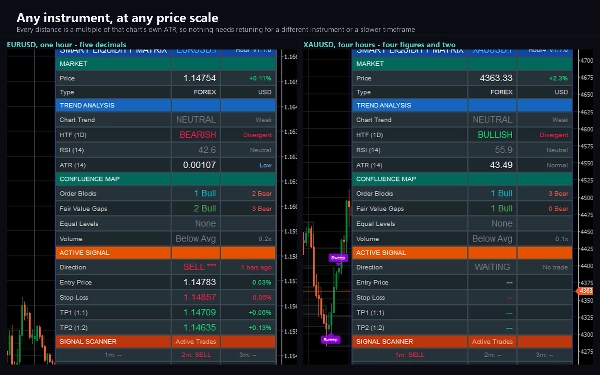
Thirty rows in six sections: market, trend analysis, confluence map, active signal, the

scanner, and a footer. Six positions, three text sizes, and it can be switched off entirely. The row

pitch is tuned for a cTrader chart pane, which is typically shorter than a browser chart.


ALERTS AND AUTOMATION


Log, sound and e-mail alerts on signals, structure events and sweeps, deduplicated so one bar raises

one message. A built-in webhook posts the same events as JSON to any address you choose, through

cTrader own networking service, so a bot or a journal can act on them. It stays off until you enter

an address, never fires while the indicator is loading history, never fires in a backtest, and is

rate limited.


The indicator requests no elevated permissions. It cannot read your files or start a process.


SETTINGS


Seventy parameters in sixteen groups. Every zone count, colour, timeframe and label position is

adjustable, and a Lite Mode thins every line for a cleaner chart.


SUITABLE FOR


Forex, indices, metals and crypto CFDs. Any timeframe; the defaults were set on one hour. The

scanner section is most informative between five minutes and four hours.


WHAT IT DOES NOT DO


It does not place, modify or close orders. It is an analysis and alerting tool. Signals are computed

on closed bars only and do not repaint.


Trading involves risk. Past performance does not guarantee future results.

Summary

AI summary
Smart Liquidity Matrix is a market structure indicator designed for use on cTrader charts, supporting Forex, indices, metals, and crypto CFDs across all timeframes. It identifies and visually marks key institutional order flow features such as order blocks, fair value gaps, equal highs and lows, liquidity sweeps, and previous period levels. Order blocks highlight the last opposite candle before confirmed swings, while fair value gaps show three-bar imbalances. Equal highs and lows are connected to indicate liquidity pools targeted by sweeps, which are marked when price wicks beyond these levels but closes back inside. The indicator also displays buy and sell signals with entry, stop, and target levels based on trend-side EMA pullbacks.

A unique feature is its 24-timeframe signal scanner, which independently analyzes from one minute to monthly intervals, showing long, short, or neutral signals to identify multi-timeframe agreement. The dashboard organizes information into six sections including market data, trend analysis, confluence, active signals, and the scanner, optimized for cTrader’s chart pane.

Alerts can be configured for signals, structure events, and sweeps, with options for log, sound, email, and webhook notifications for automation or journaling. The indicator uses closed bars only and does not repaint. It offers extensive customization with seventy adjustable parameters and a Lite Mode for cleaner visuals. It does not execute trades but serves as an analytical and alerting tool.
Indicator profile
Indicator category
Market structure (SMC)
Output type
Signals
Data requirements
Bars only
Supported signals
Breakout
Reversal
Level touch
Level break

Customer reviews

0.0
Reviews: 0
Customer reviews
No reviews for this product yet. Already tried it? Be the first to tell others!

Discussion

FAQ

Premium/Discount
Fair Value Gap
Key Levels
Liquidity Sweep
Order Block
Market Structure
Liquidity Grab
Products available through cTrader Store, including trading bots, indicators and plugins, are provided by third-party developers and made available for informational and technical access purposes only. cTrader Store is not a broker and does not provide investment advice, personal recommendations or any guarantee of future performance.

More from this author

Indicator
ATR
CCI
+4
A trend line that never steps back, a shaded band to the price, and a pointer at the swing where the trend turns.
Indicator
ADX
ATR
+5
SuperTrend signals scored on five confluence factors, with an ATR stop, three targets and a dashboard.
Indicator
ADX
ATR
+5
Ten confluence layers scored on every closed bar, with an anti-chop gate, pivot levels and a live dashboard.
Indicator
ATR
RSI
+4
RSI bands drawn on price, confluence-scored BUY/SELL signals, an ATR stop with three targets
Indicator
Volume
Channel
+3
A higher-timeframe log-regression channel with a volume profile, Point of Control and session levels.
Indicator
Volume
Key Levels
+1
Fixed-grid volume profile: bull and bear volume at every price level, with Point of Control and value area.
Indicator
ATR
BOS
+5
Know how strong each Supertrend flip is: scored BUY/SELL, structure stop + 3 targets, live win-rate dashboard, alerts.
Indicator
ATR
EMA
+3
EMA trend, RSI reclaim and divergence signals with ATR stop and two targets, swing levels and a 16-row dashboard.
Indicator
ATR
EMA
+2
Eight-EMA ribbon with ATR trade zones, a nine-symbol screener and a five-timeframe trend dashboard.
Indicator
ADX
ATR
+5
EMA-cross signals scored on six confluence layers, with an ATR stop, three targets and a live panel
Indicator
ADX
ATR
+5
Range-filter BUY/SELL flips with an ATR or swing stop, three targets, five confluence stars and a live panel
Indicator
ATR
EMA
+4
Range-filter BUY/SELL signals scored by four confluence layers, with a stop, five targets and a trend panel

You may also like

Indicator
ATR
RSI
+9
🚀 MACARX Indicator - The Multi-Indicator Trend Fusion 🚀
Indicator
ATR
RSI
+14
A metric that can set 1 to 3 groups of Bollinger Bands
Indicator
Prop
Forex
+11
Ultimate Session Tool: Boxes, OR, KZs, PD Levels, Overlaps, Custom Lines & Names, Info Panel! Highly customizable 📉📈
Indicator
ADX
ATR
+5
Range-filter BUY/SELL flips with an ATR or swing stop, three targets, five confluence stars and a live panel
Indicator
Indices
Commodities
The Advanced CCI & EMA Indicator combines the CCI with 40 & 80 EMA logic to generate precise arrows signaling direction
Indicator
ATR
EMA
+2
Eight-EMA ribbon with ATR trade zones, a nine-symbol screener and a five-timeframe trend dashboard.
Indicator
Volume
Key Levels
+1
Fixed-grid volume profile: bull and bear volume at every price level, with Point of Control and value area.
Indicator
Clean trend indicator using CCI & ATR. Highlights up/down trends with adaptive, no-repaint lines.
Indicator
SMA
Volume
+3
Stoc​h PRO Quad Rotation Signal (QRS) is an advanced technical analysis indicator developed for cTrader.
Indicator
AI
ATR
+27
🔮 Smart Bar Predictor - Professional Volatility Forecasting Indicator
Indicator
ADX
ATR
+5
SuperTrend signals scored on five confluence factors, with an ATR stop, three targets and a dashboard.
Indicator
ATR
MSS
+3
Stop drawing levels manually. SmartLevels Pro detects, scores & predicts — H4/H1/M15 · cTrader
Indicator
Key Levels
Order Block
+5
Pixel-perfect trading zones in a click! Instantly draw, resize & color via hotkeys. Automate your charting routine
Indicator
Prop
Forex
+12
Identify and trade breakouts with Consolidation Zones! Visualize price consolidation areas for trading opportunities.
Indicator
Prop
Forex
+4
HMA MTF 2.0 (Multi-Timeframe )
Indicator
Forex
Customizable Dynamic Fibonacci Channels and Smart Alerts
Indicator
RSI
Signal
+2
Identifies trends with moving averages & volatility. Base levels = bullish 🐂 or bearish 🐻 signals. Reversals detected!
Indicator
Forex
Crypto
+3
Detect powerful 2-candle reversal patterns at key highs/lows. Boost entries with real-time alerts and visual signals.

Price

3
Sales



























