Descrizione
✨ Caratteristiche principali
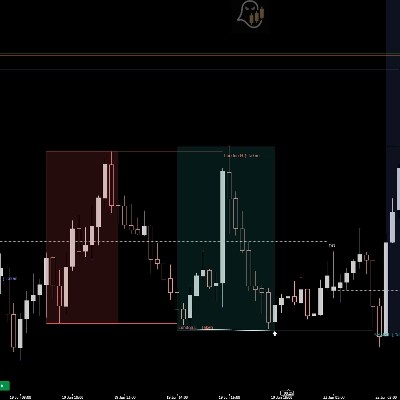
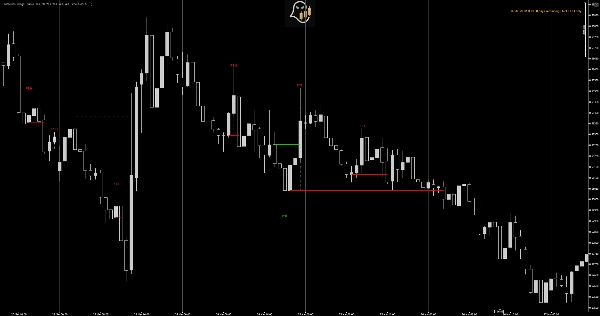
🔍 Rilevamento Sweep di Liquidità
- Identifica automaticamente quando il prezzo supera i livelli pivot per catturare liquidità
- Distingue tra breakout genuini e movimenti falsi (stop hunt)
- Evidenzia la zona esatta dove la liquidità è stata presa
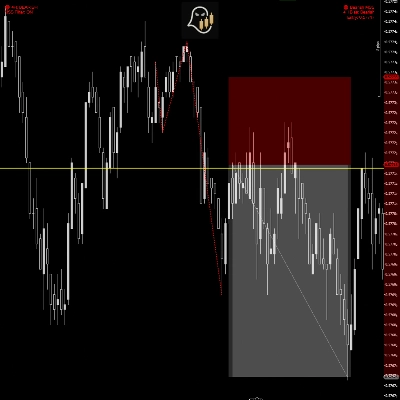
📦 Analisi Fair Value Gap (FVG)
- Rileva in tempo reale Fair Value Gap rialzisti e ribassisti
- Monitora la mitigazione degli FVG su più timeframe
- Riquadri visivi mostrano gap attivi e il loro stato di riempimento
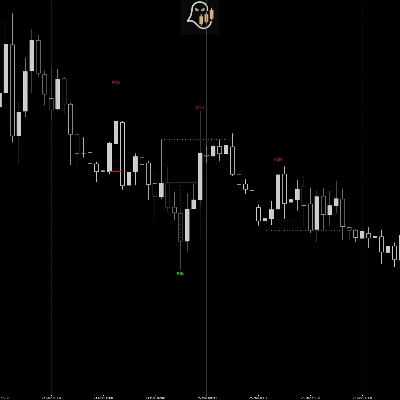
🎯 Identificazione Swing Protetti
- Segna i Minimi Swing Protetti (PSL) e i Massimi Swing Protetti (PSH)
- Segnala solo quando gli swing seguono sweep di liquidità O mitigazioni FVG
- Elimina il rumore filtrando i punti swing insignificanti
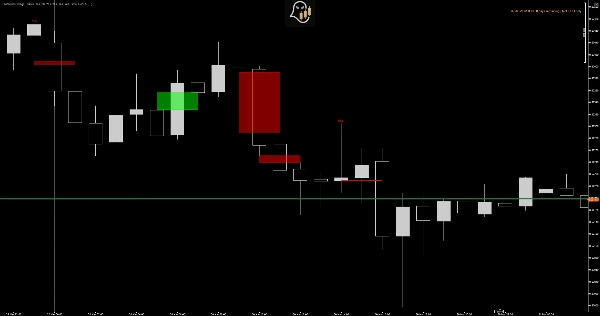
⚡ Logica di Conferma CISD
- Usa la metodologia "change in state of delivery"
- Attende che il prezzo confermi sopra/sotto livelli chiave
- Invalida automaticamente i setup quando vengono colpiti gli stop
🎨 Visualizzazione Professionale
- Visualizzazione del grafico pulita e non invasiva
- Colori e trasparenza personalizzabili
- Tooltip dettagliati che mostrano il motivo di ogni segnale
- Estensione automatica dei livelli per una facile pianificazione degli obiettivi
💡 Perché gli Swing Protetti?
Il Problema degli Indicatori Tradizionali
La maggior parte degli indicatori swing segna ogni massimo e minimo, creando confusione nel grafico e falsi segnali. Non differenziano tra fluttuazioni casuali del prezzo e attività istituzionali genuine.
La Soluzione degli Swing Protetti
Richiedendo uno sweep di liquidità O una mitigazione FVG prima di segnare uno swing, questo indicatore assicura che vengano mostrati solo setup dove il denaro intelligente ha mostrato la sua mano. Questo migliora drasticamente la qualità dei segnali e riduce i falsi movimenti.
🚀 Come Funziona
1. Fase di Rilevamento
L'indicatore scansiona continuamente per:
- Massimi e minimi pivot (sensibilità configurabile)
- Sweep di liquidità (movimenti wick-only oltre i pivot)
- Fair Value Gap (inefficienze di prezzo)
2. Formazione dello Swing
Quando si forma un minimo/massimo swing E segue uno dei seguenti:
- Uno sweep di liquidità di un pivot precedente, O
- Il prezzo entra in un Fair Value Gap, l'indicatore lo segna come swing protetto "in sospeso".
3. Fase di Conferma (CISD)
Lo swing è confermato solo quando:
- Per PSL: Il prezzo chiude sopra il livello senza rompere il minimo dello swing
- Per PSH: Il prezzo chiude sotto il livello senza rompere il massimo dello swing
4. Invalidazione
Se il prezzo rompe il punto swing prima della conferma, il setup viene scartato. Questo mantiene i tuoi grafici puliti e si concentra solo su setup validi.
📈 Applicazioni di Trading
Ingressi di Continuazione del Trend
- PSL in trend rialzista = opportunità di acquisto con stop stretti
- PSH in trend ribassista = opportunità di vendita con rischio definito
Trading di Reversal
- Molteplici PSL a livelli simili = zona di forte accumulo
- Molteplici PSH a livelli simili = zona di distribuzione/resistenza
Posizionamento Stop Loss
- Posiziona gli stop appena oltre i PSL confermati per posizioni long
- Posiziona gli stop appena oltre i PSH confermati per posizioni short
- La metodologia Stop Defended garantisce un posizionamento ottimale del rischio
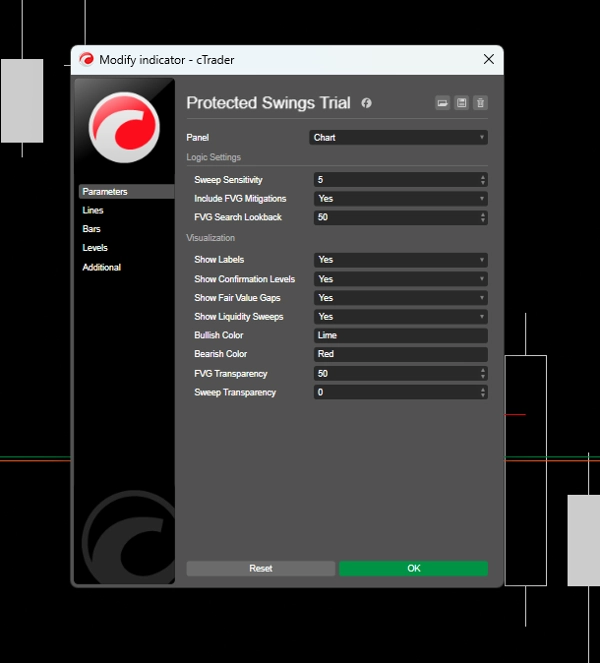
⚙️ Parametri Personalizzabili
Impostazioni Logiche
- Sensibilità Sweep (1-20): Controlla l'importanza del pivot - più alto = meno segnali ma più forti
- Includi Mitigazioni FVG: Attiva/disattiva segnali basati su FVG
- Lookback Ricerca FVG: Durata di attività degli FVG
### Visualizzazione
- Mostra Etichette: Visualizza marcatori PSL/PSH
- Mostra Livelli di Conferma: Disegna linee orizzontali ai livelli di ingresso
- Mostra Fair Value Gap: Visualizza riquadri FVG
- Mostra Sweep di Liquidità: Evidenzia zone di sweep
- Colori Personalizzati: Personalizzazione completa dei colori per elementi rialzisti/ribassisti
- Controlli di Trasparenza:** Regola l'intensità visiva a tuo piacimento
## ⚠️ Limitazioni della Versione di Prova
Questa è una VERSIONE DI PROVA DI 7 GIORNI con le seguenti restrizioni:
✅ Cosa è incluso:
- Funzionalità completa dell'indicatore
- Tutte le funzionalità sbloccate
- Supporto per tutti i timeframe su NZDUSD
- Personalizzazione completa dei parametri
❌ Restrizioni:
- Simbolo: Funziona solo su grafici NZDUSD
- Durata: Periodo di prova di 7 giorni dall'installazione
- Supporto: Supporto limitato per la prova
### 🔓 Vantaggi della Versione Completa
- Funziona su TUTTE le coppie di valute, azioni, indici e materie prime**
- Accesso a vita - senza scadenza
- Aggiornamenti gratuiti a vita
- Supporto prioritario da GhostInTheSpread
- Guida utente dettagliata con strategie di trading
- Tutorial video e guide di configurazione
Riepilogo
Recensioni dei clienti
5 | 50 % | |
4 | 50 % | |
3 | 0 % | |
2 | 0 % | |
1 | 0 % |