present
Zarejestruj się i otrzymaj 50 $ zniżki na pierwszy zakup
Trading product for XAUBouncer Wskaźnik Spread Filter Session Filter, image 1
XAUBouncer
Wskaźnik
84 pobrania
Wersja 1.1, Jul 2026
Windows, Mac
5.0
Opinie: 3
Trading product for XAUBouncer Wskaźnik Spread Filter Session Filter, image 2
Trading product for XAUBouncer Wskaźnik Spread Filter Session Filter, image 3
Trading product for XAUBouncer Wskaźnik Spread Filter Session Filter, image 4
Trading product for XAUBouncer Wskaźnik Spread Filter Session Filter, image 5
Trading product for XAUBouncer Wskaźnik Spread Filter Session Filter, image 6
Od 17/06/2026
137
Bezpłatne instalacje

Opis

XAU Bouncer: czysty wykres złota dla cTrader

XAU Bouncer jest wizualną nakładką na wykres stworzoną dla traderów, którzy analizują XAUUSD ręcznie i chcą mieć główny kontekst złota w jednym miejscu.

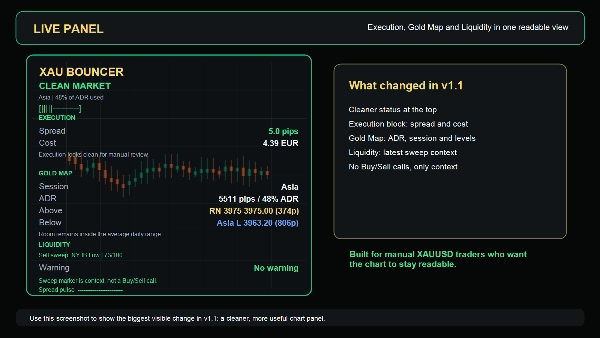
Przed podjęciem transakcji na złocie warto wiedzieć, gdzie cena znajduje się w odniesieniu do ważnych poziomów dnia, która sesja jest aktywna, ile z przeciętnego dziennego zakresu zostało już wykorzystane oraz czy obecny spread jest nadal rozsądny. XAU Bouncer umieszcza te informacje bezpośrednio na wykresie, nie zamieniając go w zatłoczony panel kontrolny.

To nie jest zautomatyzowany system handlowy i nie generuje sygnałów Kupna ani Sprzedaży. Został zaprojektowany jako narzędzie wspomagające decyzje dla traderów manualnych, którzy chcą czytelniejszego obrazu rynku przed podjęciem działania.

Co pokazuje

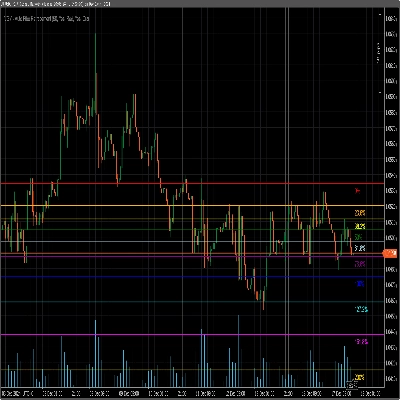
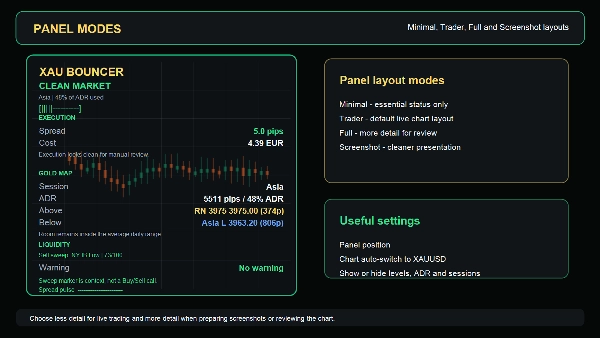
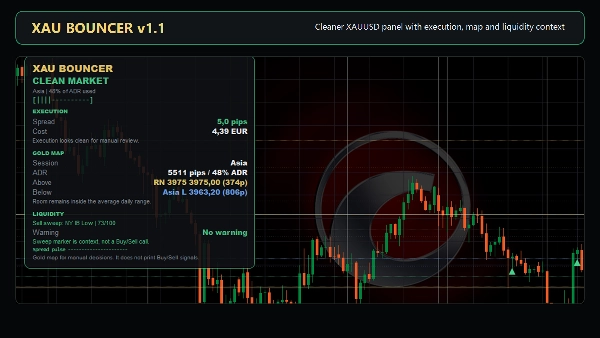
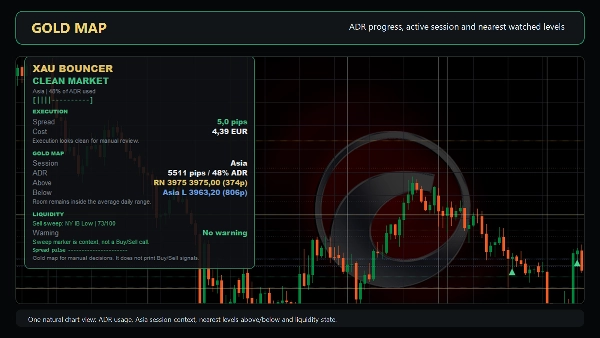
  • Panel warunków na żywo XAUUSD z symbolem, spreadem, aktywną sesją, licznikiem świec i stanem rynku.
  • Postęp dziennego zakresu w porównaniu z ADR, dzięki czemu możesz zobaczyć, kiedy złoto jest już rozciągnięte na dany dzień.
  • Poziomy z poprzedniego dnia w tym maksimum, minimum, otwarcie i środek.
  • Zakres Azji maksimum i minimum do planowania sesji londyńskiej i nowojorskiej.
  • Początkowy bilans Nowego Jorku maksimum, minimum i środek.
  • Projekcje stref ADR od otwarcia dnia.
  • Poziomy okrągłych liczb dla złota, takie jak 4200, 4225, 4250 i podobne magnesy cenowe.
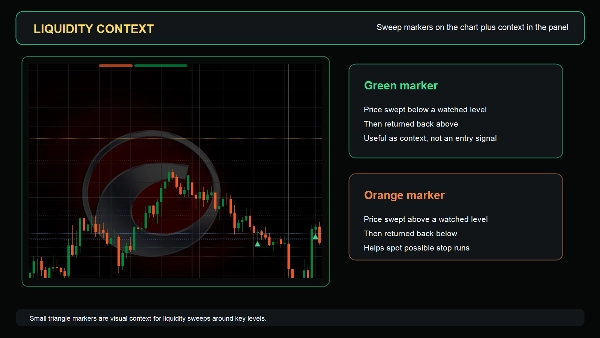
  • Markery zmiatania płynności kiedy cena sięga obserwowanego poziomu i wraca z powrotem do środka.
  • Kontekst ostrzeżenia o spreadzie na momenty, gdy warunki realizacji stają się mniej atrakcyjne.

Jak traderzy go używają

  • Przygotuj wykres XAUUSD przed sesjami londyńską i nowojorską.
  • Zobacz pobliskie strefy reakcji bez ręcznego rysowania każdego poziomu.
  • Sprawdź, czy złoto handluje się w pobliżu stref wyczerpania ADR.
  • Obserwuj, jak cena zachowuje się wokół poziomów z poprzedniego dnia, zakresu Azji i okrągłych liczb.
  • Używaj markerów zmiatania jako kontekstu wizualnego, a nie automatycznych sygnałów wejścia.
  • Trzymaj informacje o spreadzie i sesji widoczne przed podjęciem decyzji manualnej.

Najlepsze dla

  • Manualnych traderów XAUUSD.
  • Pracy intraday i skalpowania.
  • Analizy price action, płynności, zakresu sesji i kluczowych poziomów.
  • Traderów, którzy wolą czysty wykres zamiast kilku oddzielnych wskaźników.

Zalecane użycie

  • Rynek: XAUUSD lub specyficzne dla brokera symbole złota przez parametr Gold Symbol.
  • Interwały czasowe: M15, M30, H1 i H4.
  • Styl: ręczna analiza, planowanie sesji i kontekst realizacji.

Ważna uwaga

XAU Bouncer nie jest robotem handlowym, doradcą finansowym ani obietnicą zysku. Nie otwiera, nie zamyka ani nie zarządza transakcjami. Jest wizualnym narzędziem wspomagającym decyzje do ręcznej analizy złota na cTrader.

Handel wiąże się z ryzykiem. Wyniki historyczne nie gwarantują przyszłych rezultatów.

Podsumowanie

AI summary
XAUBouncer is a visual chart overlay designed for manual traders analyzing XAUUSD (gold) on the cTrader platform. It consolidates key market context into a clean, uncluttered display to support decision-making without automated trade signals. The overlay provides a live conditions panel showing symbol, spread, active session, candle timer, and market state. It tracks daily range progress relative to the average daily range (ADR) and displays important reference levels including previous day’s high, low, open, and mid, as well as Asia Range and New York Initial Balance levels. Projected ADR zones from the daily open and round number price levels serve as potential reaction points. Liquidity sweep markers highlight instances when price tests and retreats from key levels. A spread warning feature indicates moments when execution conditions may be less favorable. XAUBouncer is optimized for intraday and scalping workflows on M15, M30, H1, and H4 timeframes. It is intended for traders focusing on price action, liquidity, session ranges, and key level analysis who prefer a streamlined chart view over multiple separate indicators. This tool does not execute trades or provide buy/sell signals; it functions solely as a decision support aid for manual gold trading.
Profil wskaźnika

Opinie klientów

5.0
Opinie: 3
5
100 %
4
0 %
3
0 %
2
0 %
1
0 %
Opinie klientów
September 9, 2026
This is a pretty good indicator for gold trading. I mainly trade DE40 but when I trade XAUUSD I definitely use this indicator. It shows you all the session, ADR and other useful stuff.
July 16, 2026
XAUBouncer is an excellent, all-in-one context map for manual Gold traders on cTrader. Instead of cluttering your chart with separate indicators, it combines ADR projections, previous day levels, Asia/NY session ranges, and liquidity sweep markers into one clean overlay. The auto-symbol switch is a great touch for broker compatibility. While it lacks alerts and is strictly for XAU, it’s a fantastic decision-support tool for intraday traders looking to map out key reaction zones before Lo/NY open
June 30, 2026
Good indicator for manual XAUUSD trading. I like that it shows the key zones in one place: sessions, Asia Range, New York Initial Balance, daily range, previous day levels and spread. The chart stays clean and the analysis becomes faster. Useful tool for intraday trading and price action.

Dyskusja

Częste pytania

Spread Filter
Session Filter
Key Levels
Liquidity Sweep
ATR
Liquidity Grab
Support & Resistance
Produkty dostępne za pośrednictwem cTrader Store, w tym boty handlowe, wskaźniki i wtyczki, dostarczane są przez deweloperów zewnętrznych i udostępniane wyłącznie w celach informacyjnych oraz w celu zapewnienia dostępu technicznego. cTrader Store nie jest brokerem i nie zapewnia doradztwa inwestycyjnego, nie udziela spersonalizowanych rekomendacji ani nie gwarantuje przyszłych wyników.

Więcej od tego autora

Wskaźnik
Volume
Account-wide discipline HUD that explains tilt patterns and compares Clean versus Flagged P&L in real time.
Wskaźnik
Key Levels
Liquidity Grab
+2
A practical XAUUSD workspace for mapped levels, session context, liquidity events, alerts and risk planning.
Wskaźnik
ATR
Key Levels
+1
See how price reaches your level with clear states, ATR distance, touch count, level wear and spread context.

Możesz także polubić

Wskaźnik
ICT ALL KİLL ZONES, LONDON , ASİA, NY AM, NY LUNCH, NY PM
Wskaźnik
Prop
Forex
+12
A clean, real-time risk HUD designed to prevent prop firm account failure and protect your challenge account.
Wskaźnik
SMC
VWAP
+4
Killzone Session and key levels with VWAP – Precision Meets Price Action
Wskaźnik
BOS
MSS
+5
Your entire ICT session map, structure engine, and key levels — No manual work. One indicator. Every session!
Logo „Cross EMA Pro”
Najwyżej oceniane
4.4
(5)
$49
Wskaźnik
Forex
BTCUSD
+5
Cross EMA Pro – Trend Reversal Indicator
Wskaźnik
SMC
Forex
+5
MMXM Structure by LudwigICT – Professional Market Structure Mapping Tool
Wskaźnik
A rectangular box with 5 adjustable Fibonacci level or even custom ones.
Wskaźnik
Volume
Custom range volume profile between two draggable anchors. Auto source timeframe, Total/Up-Down/Delta, POC, Value Area.
Wskaźnik
ATR
Simple professional trend tracker
Wskaźnik
SMC
Prop
+17
Unlock the true intent of market participants with the Classic Proportional Cumulative Volume Delta CVD!
Wskaźnik
ATR
Key Levels
It combines the trend-filtering power of Renko charts with the volatility tracking of ATR Bands
Wskaźnik
Prop
Forex
+14
Stochastic Momentum Index (SMI) for cTrader optional higher-timeframe source, and clear overbought/oversold levels.
Wskaźnik
Auto Fibonacci Retracement Indicator.
Wskaźnik
Signal
Dark Poll Signal Indicator.liquidity leakage,precedes the great movement, accumulation, distribution
Wskaźnik
BOS
CHOCH
+4
Dual-track market structure detection with BVC order flow confirmation and two-stage liquidity sweep validation.
Wskaźnik
ATR
EMA
+4
Range-filter BUY/SELL signals scored by four confluence layers, with a stop, five targets and a trend panel
Wskaźnik
Imbalance
Fair Value Gap
+1
Multi-symbol, multi-timeframe Fair Value Gaps in one panel.
Wskaźnik
Signal
New Trend whit buy-sell signal

Cena

Od 17/06/2026
137
Bezpłatne instalacje