


Descrizione
Hyper Trend PRO non si limita a dirti che la tendenza è cambiata. Ti dice quanto il resto del grafico è d'accordo.
Come viene generato un segnale
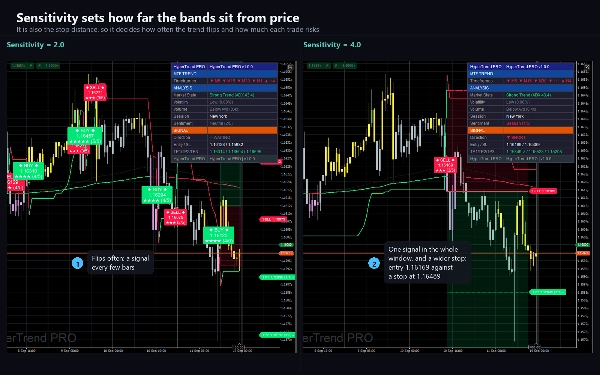
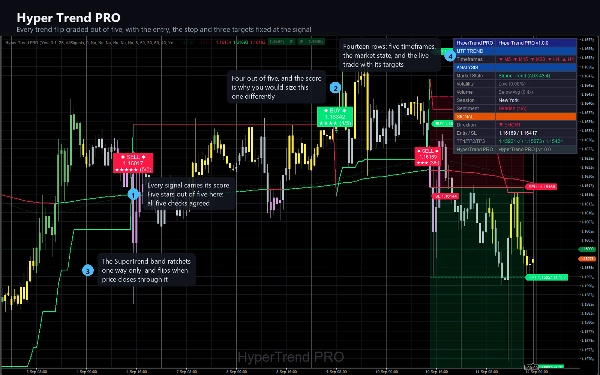
Un SuperTrend basato sull'average true range segna la tendenza. Bande sono posizionate sopra e sotto il prezzo a un multiplo di un ATR a 25 barre, ogni banda si muove in una sola direzione, e la tendenza cambia quando il prezzo chiude oltre la banda sul lato opposto. Ogni segnale inizia come uno di questi cambiamenti e nulla altro ne genera uno.
Il cambiamento viene poi valutato su cinque punti. Cinque fattori indipendenti votano:
- l'istogramma MACD, in aumento o diminuzione rispetto alla barra precedente
- la EMA a 150 periodi rispetto alla EMA a 250 periodi
- ADX sopra 20, quindi un cambiamento all'interno di un range morto è segnato come tale
- volume rispetto alla sua media a 20 barre
- la pendenza di una media mobile Hull a 55 periodi
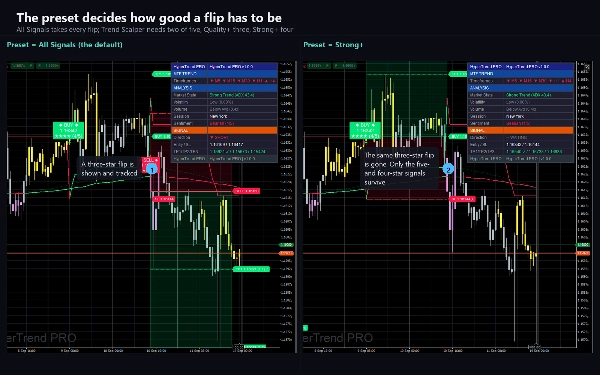
Il punteggio viene mostrato sul segnale come stelle e come numero su cinque, e nominato nell'allerta come Debole, Moderato o Forte. È la differenza tra un cambiamento con cui quattro altre misure concordano e uno che rimane isolato.
Scelta del livello di selettività
Un preset imposta il punteggio minimo che un cambiamento deve ottenere: All Signals prende tutto, Trend Scalper ne richiede due, Quality+ tre e Strong+ quattro. Sei filtri aggiuntivi possono ciascuno veto un segnale da soli: solo mercati in trend, solo punteggi forti, solo volume sopra la media, solo allineati con la nuvola, e una modalità contraria che prende un cambiamento solo quando un RSI smussato è già esteso nella direzione opposta. Ognuno di essi è disattivato finché non lo attivi.
Il trade che disegna
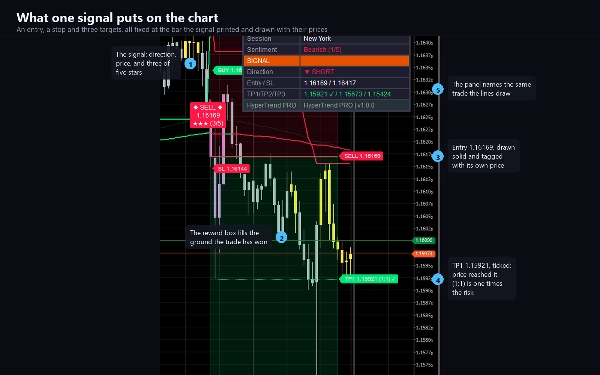
Nel momento in cui un segnale appare, l'indicatore fissa un ingresso, uno stop e tre obiettivi e disegna ciascuno come una linea etichettata con il suo prezzo.
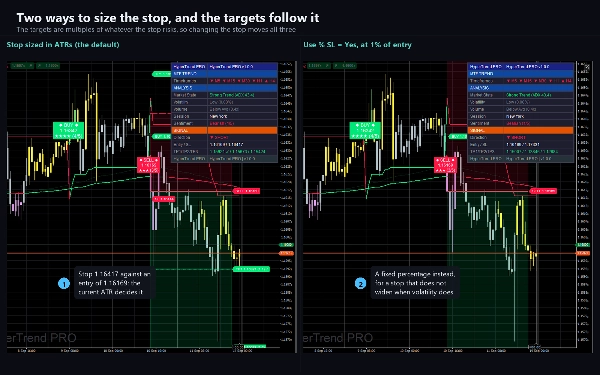
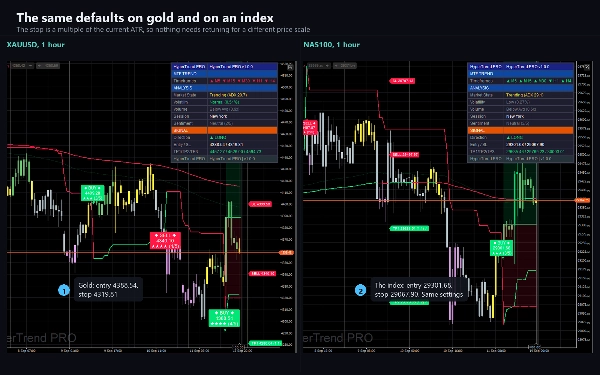
- Lo stop è un multiplo dell'ATR corrente, quindi le stesse impostazioni si comportano in modo sensato su un grafico a cinque minuti e su uno giornaliero, e su una coppia di valute e sull'oro. È disponibile invece uno stop a percentuale fissa.
- I tre obiettivi sono multipli dello stesso rischio, quindi i valori predefiniti di 1.0, 2.0 e 3.0 sono letteralmente uno, due e tre volte ciò che stai rischiando.
- Ogni obiettivo viene spuntato quando il prezzo lo raggiunge. Raggiungere il terzo obiettivo, o lo stop, chiude il trade tracciato.
- Uno stop trailing ATR opzionale viene disegnato dietro un trade aperto.
Cos'altro c'è sul grafico
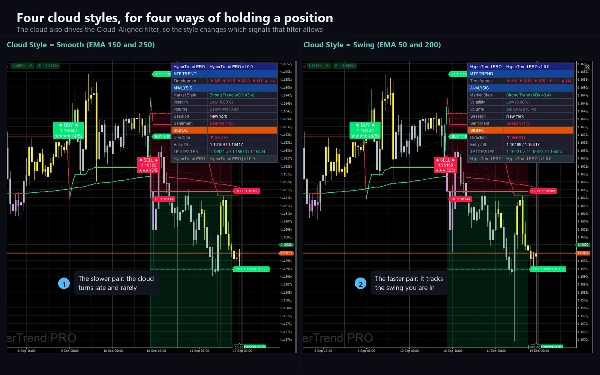
- Una nuvola tra due medie mobili, in quattro stili: una coppia EMA smussata, due varianti per scalping e una coppia per swing.
- Una linea Trend Tracer a 250 periodi che cambia colore con il prezzo.
- Candele colorate attraverso sei gradazioni in base alla forza dell'istogramma MACD rispetto alla volatilità, così un movimento che si indebolisce è visibile prima che cambi. L'impostazione Candle Coloring le cambia nei colori del trend, le sfuma in base al punteggio di confluenza, o le lascia inalterate quando un altro indicatore colora le candele sullo stesso grafico.
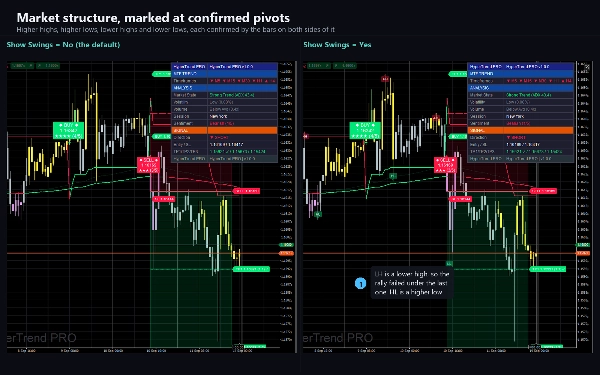
- Etichette opzionali di struttura di mercato che segnano massimi più alti, massimi più bassi, minimi più alti e minimi più bassi.
- Marcatori opzionali di pullback da un oscillatore WaveTrend, per rientri all'interno di un trend piuttosto che all'inizio.
La dashboard
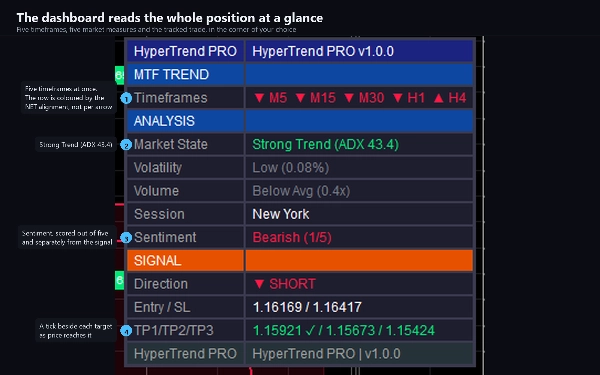
Quattordici righe nell'angolo a tua scelta. Il blocco superiore legge cinque timeframe contemporaneamente, da M5 a H4, e mostra verso quale direzione ognuno tende. Sotto: lo stato del mercato con il suo ADX, la volatilità come percentuale del prezzo, il volume rispetto alla sua media, la sessione di trading, e un secondo punteggio a cinque punti per il sentimento complessivo. Il blocco inferiore è l'ultimo segnale, il suo ingresso e stop, e i suoi tre obiettivi con una spunta accanto a ciascuno raggiunto.
Avvisi
Nove eventi, ciascuno con il proprio interruttore: acquisto, vendita, qualsiasi segnale, segnale forte, lo stop, i tre obiettivi e un cambio di trend. Ognuno si attiva una volta per barra chiusa e mai per la storia, quindi collegarlo a un grafico lungo non produce una valanga di vecchi avvisi. La consegna avviene nel log di cTrader, un suono opzionale e una e-mail opzionale tramite le tue impostazioni cTrader.
Impostazioni
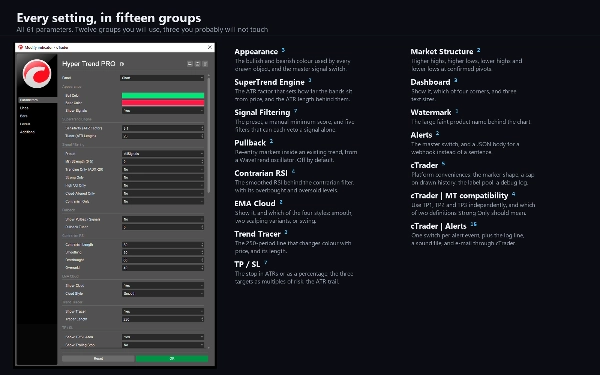
62 parametri in dodici gruppi che userai e tre che probabilmente non toccherai. Aspetto, motore SuperTrend, filtraggio segnali, pullback, RSI contrarian, la nuvola, il tracer, rischio, struttura di mercato, dashboard, watermark e avvisi. Il resto sono comodità di cTrader: modalità di colorazione delle candele, uno stile di marcatore, un limite per gli oggetti, un log di debug, tre interruttori di compatibilità e un interruttore per ogni evento di avviso.
Tipo, timeframe e strumenti
Un indicatore overlay per l'analisi di trend e momentum. La sua media più lunga è di 250 barre, quindi richiede un grafico con un po' di storia; M15, H1 e H4 sono la finestra per cui è stato progettato, e funziona su qualsiasi timeframe. È stato testato su principali coppie di valute, sull'oro e sugli indici. Usa barre e volume: nessun dato tick, nessuna profondità di mercato, nessun dato esterno.
A chi è rivolto
Trader che vogliono un segnale di trend che venga con un voto piuttosto che un sì o no, e che vogliono che stop e obiettivi siano decisi nello stesso momento dell'ingresso piuttosto che dopo.
La versione di prova
La versione di prova è questa stessa build con una restrizione: funziona solo su EURUSD, e sono accettati suffissi broker come EURUSD.i. Non c'è limite di tempo e ogni parametro è disponibile. La versione completa aggiunge ogni altro simbolo.
Note tecniche
I segnali non si ridisegnano. Vengono valutati solo su barre chiuse, quindi un marcatore non appare mai durante una candela per poi sparire alla chiusura. Il costo è un ritardo di una barra, ed è voluto. Mentre un trade è aperto, le sue linee di livello e le loro etichette si estendono a destra con il grafico, che muove il disegno e non i livelli.
L'indicatore non dichiara diritti di accesso. Non apre connessioni di rete, non legge file e non piazza, modifica o chiude ordini. Le spunte sulla dashboard registrano che il prezzo ha toccato un livello disegnato sulla storia caricata, senza spread, commissioni o slippage.
Supporto
Le domande vanno attraverso la scheda Discussione di questo elenco. Si prega di includere il simbolo, il timeframe, il broker, la versione di cTrader e uno screenshot con la dashboard visibile.
Il trading comporta rischi. Le performance passate non garantiscono risultati futuri.
Riepilogo
The indicator fixes entry points, ATR-based stops, and three risk-multiplied targets at the moment a signal occurs, with optional trailing stops. Multiple filters allow users to customize signal selectivity, including trend strength, volume, cloud alignment, and contrarian RSI conditions.
Additional chart features include a configurable cloud between moving averages, a 250-period Trend Tracer line, candle tinting based on MACD strength, market structure labels, and pullback markers from a WaveTrend oscillator. A dashboard displays multi-timeframe trend direction, market state, volatility, volume, session info, sentiment scores, and trade progress.
Hyper Trend PRO supports major currency pairs, gold, and indices, using bar and volume data without tick or external inputs. Alerts cover nine event types with controlled delivery. The indicator does not repaint and operates with a one-bar delay for signal confirmation. It requires no special access rights or order execution capabilities.





























