
설명
다중 타임프레임 기간 오버레이 및 MTF 바이어스 지표 개요
MTF 기간 오버레이 및 바이어스 어시스턴트는 cTrader용으로 제작된 종합적인 다중 타임프레임(MTF) 오버레이 지표입니다. 이는 고수준 시장 구조, 세션 유동성 및 리스크 관리 지표를 낮은 타임프레임 실행 차트(M1–M15)에 직접 집계하도록 설계되어 차트 탭 간의 지속적인 전환 필요성을 최소화합니다.
분석된 시장 데이터 및 조건
이 지표는 여러 핵심 가격 행동 지표 간의 합류를 평가합니다:
- 다중 타임프레임 바이어스: 일간, H4, H1 및 M15 타임프레임에서 방향성 바이어스(강세, 약세 또는 횡보)를 동시에 평가합니다.
- 공급 및 수요 (S&D): 유효한 스윙 포인트, 충격적 움직임 및 기본 캔들을 자동으로 감지하여 공급 및 수요 구역을 그립니다. 또한 공정 가치 갭(FVG)을 적극적으로 필터링하여 이 구역들을 검증합니다.
- 프리미엄 대 할인 가격: 일간 중간점(평형점 또는 EQ)을 계산하여 현재 가격 행동이 프리미엄(비싼) 영역인지 할인(저렴한) 영역인지 판단합니다.
- 변동성 및 리스크 용량: 일간 평균 진폭(ATR)을 추적하여 일반적인 일간 움직임 중 얼마나 소비되었는지 측정하며, 소진된 시장에서 거래가 이루어지지 않도록 보장합니다.
시각적 요소 및 해석
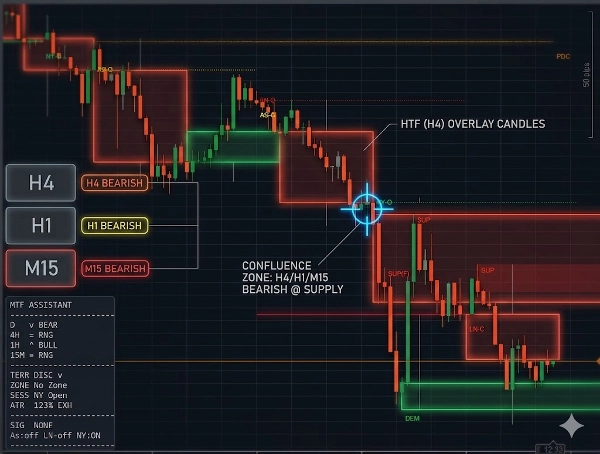
- HTF 캔들 오버레이 (v2.19)에서 새로 추가됨: 투명하고 넓은 고타임프레임 캔들(예: H1 또는 H4)을 M1-M15 차트 위에 직접 렌더링합니다. 실시간 "라이브" 블록은 낮은 타임프레임 바가 닫힐 때 확장되어 현재 미세 가격 행동이 고타임프레임 캔들을 어떻게 형성하는지 정확히 볼 수 있습니다.
- S&D 존 박스: 유효한 구역을 표시하는 시각적 사각형입니다. 이들은 동적으로 라벨링되며, 구역이 테스트된 횟수를 추적합니다(예: "Chart DEM-F"는 새 수요 구역, "DEM 1x"는 재테스트된 구역).
- 바이어스 테이블: D1, H4, H1 및 M15 전반의 추세를 요약하는 맞춤형 색상 코드 온스크린 대시보드로, 시장 정렬 여부를 즉시 명확히 보여줍니다.
- 거래 신호: 엄격한 조건이 충족될 때 구별되는 색상 코드의 매수/매도 신호를 표시합니다(예: 가격이 할인 구역에 있고, 신선한 수요 레벨에 닿으며, 엔골핑 또는 핀 바 패턴을 형성하고, MTF 바이어스와 일치하며, 사용 가능한 ATR이 있는 활성 거래 세션 내에 있을 때).
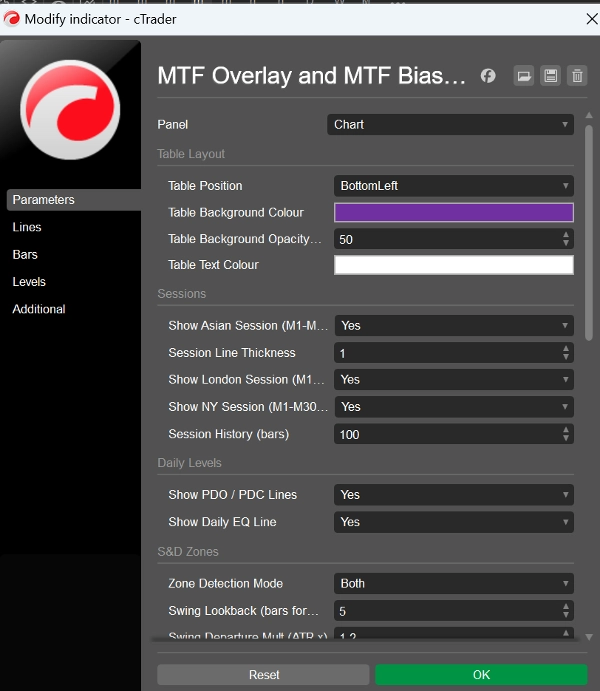
- 세션 및 일간 레벨: 아시아, 런던, 뉴욕 세션 오픈에 대한 수직선과 이전 일간 오픈(PDO), 이전 일간 클로즈(PDC), 일간 평형선에 대한 수평선을 그립니다.
주요 설정 및 매개변수
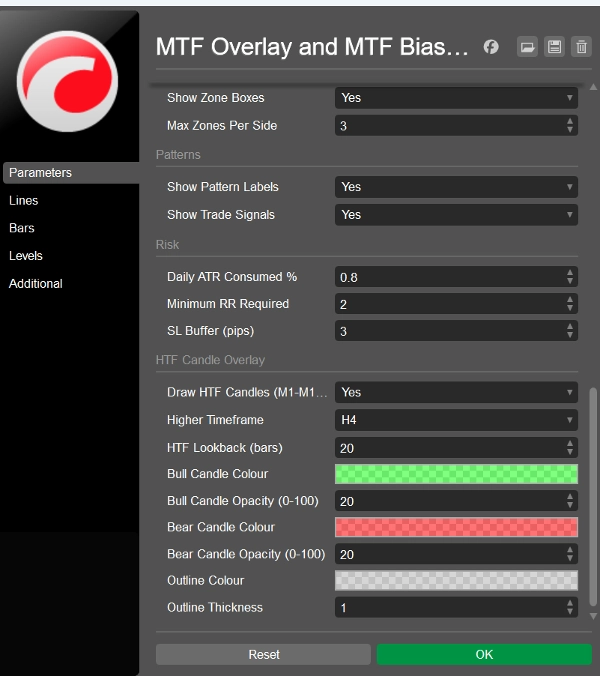
- HTF 캔들 오버레이:
DrawHtfCandles,HtfTimeframe(H1/H4/D1) 및 차트 혼잡을 방지하기 위한 매우 사용자 정의 가능한 불투명도/색상 설정. - S&D 존:
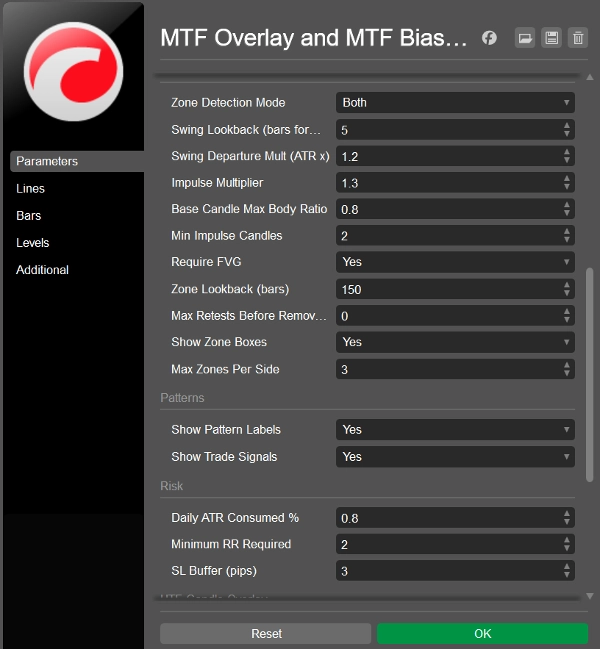
RequireFVG(엄격한 구조 규칙 전환),Max Retests Before Remove(깨진 구역을 제거하여 차트를 깔끔하게 유지), 그리고Impulse Multiplier(구역으로 인정받기 위한 움직임의 강도 결정). - 리스크 관리:
Daily ATR Consumed %(예: 일간 범위의 80%가 이미 충족된 경우 거래 제한) 및Minimum RR Required(거래 매개변수가 최소 위험 대비 보상 비율을 충족하도록 보장).
일반적인 사용 사례 및 시나리오
이 도구는 고확률의 일중 추세 지속 설정을 위해 제작되었습니다.
- "정렬된 되돌림" 시나리오: 트레이더가 D1, H4, H1 바이어스가 모두 강세임을 관찰합니다. M15 차트로 전환합니다. 지표는 가격이 일간 범위의 "할인" 절반으로 떨어져 신선한 H1 수요 구역에 닿았음을 표시합니다. 런던 세션이 열리면서 강세 엔골핑 캔들이 형성됩니다. 지표는 ATR 한도를 검증하고 매수 신호를 트리거하여 높은 합류 진입을 확인합니다.
적합 대상
- 트레이더 프로필: 가격 행동을 활용한 공급 및 수요 방법론을 사용하는 일중 데이 트레이더 및 스캘퍼. 주문 블록, 유동성 스윕 및 다중 타임프레임 정렬에 중점을 둔 전략과 완벽하게 보완됩니다.
- 경험 수준: 중급에서 고급. 초보자는 정보 밀도(FVG, 프리미엄/할인, MTF 바이어스)에 압도될 수 있습니다.
- 특정 환경: 금(XAU/USD) 또는 변동성이 큰 지수를 거래하는 트레이더, 특히 내장된 ATR 소진 및 최소 RR 필터가 자본 보존에 중요한 독점 트레이딩 회사 평가의 엄격한 드로우다운 매개변수 내에서 운영하는 경우.
중요한 제한 사항 및 사용 참고
- 차트 특이성: HTF 캔들 오버레이 및 특정 S&D 존은 엄격히 M1–M15 차트에만 적용됩니다. M30 차트 이상에 지표를 적용하면 시각적 왜곡을 방지하기 위해 오버레이가 억제됩니다.
- 지연 바이어스: 고타임프레임 바이어스(D1, H4)는 닫힌 캔들에 의존합니다. 변동성이 크거나 뉴스 중심 환경에서는 바이어스가 전환되는 데 시간이 걸릴 수 있어, 지표가 공격적인 반전을 "횡보"로 표시할 수 있습니다(더 큰 캔들이 닫힐 때까지).
- 자동 봇 아님: 거래 신호는 높은 합류 조건에 대한 알림일 뿐, 보장된 실행 명령이 아닙니다. 기본 동인 및 거시경제적 맥락을 평가하는 재량이 필요합니다.
요약
AI 요약
The Multi-Timeframe Bias Assistant is a cTrader indicator designed to consolidate multi-timeframe market analysis onto lower-timeframe charts (M1–M15). It evaluates directional bias simultaneously across Daily, H4, H1, and M15 timeframes, providing a comprehensive view of market trends. The indicator automatically identifies key Supply and Demand zones by detecting swing points, impulsive moves, and base candles, validated through Fair Value Gaps (FVGs). It calculates the daily midpoint to classify price action as Premium or Discount and tracks daily volatility via the Average True Range (ATR) to assess risk capacity.
Visual features include transparent higher timeframe candle overlays, dynamic Supply and Demand zone boxes with retest counts, and a color-coded Bias Table summarizing trend alignment. Trade signals appear when multiple conditions align, such as price in Discount zones, fresh Demand levels, specific candlestick patterns, and ATR limits within active trading sessions. The indicator also marks major session opens and daily reference levels.
Settings allow customization of overlays, zone strictness, retest limits, and risk parameters like ATR consumption and minimum risk-to-reward ratios. It is suited for intermediate to advanced intraday traders focusing on Supply and Demand, order blocks, liquidity sweeps, and multi-timeframe alignment, particularly on instruments like Gold (XAU/USD) and volatile indices. The tool supports visualization and level-touch signals based on bar and tick data.
지표 프로필
지표 카테고리
시장 구조 (SMC)
출력 유형
시각화
데이터 요구 사항
막대만
틱 데이터
지원되는 신호
반전
레벨 터치
고객 리뷰
0.0
리뷰: 0
고객 리뷰
이 상품에 대한 리뷰가 아직 없습니다. 이미 사용해 보셨나요? 다른 사람들에게 가장 먼저 소개해 주세요!
상담
자주 묻는 질문(FAQ)
Fair Value Gap
Liquidity Sweep
Order Block
Market Structure
Supply & Demand
트레이딩 봇, 지표, 플러그인 등 cTrader Store에서 제공되는 상품은 제3자 개발자에 의해 제공되며, 이는 단순히 정보 및 기술적 접근을 목적으로 제공된 것입니다. cTrader Store는 중개인이 아니며, 투자 조언, 개인별 추천 또는 향후 성과에 대한 어떠한 보장도 제공하지 않습니다.
이 작성자의 상품 더 보기


가격
99.84M
거래량
16.78K
핍 수익