

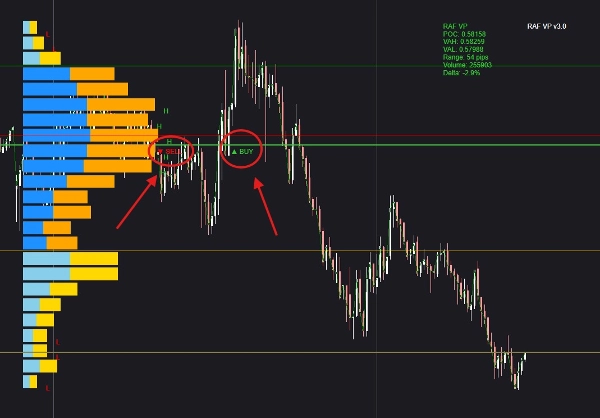
설명
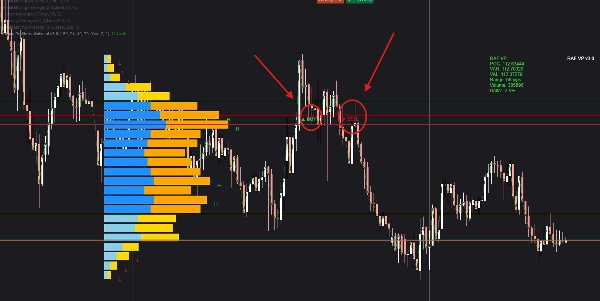
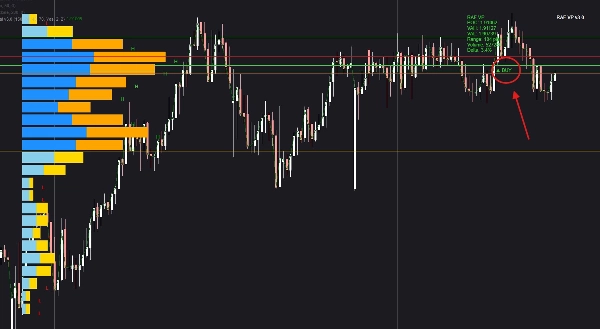
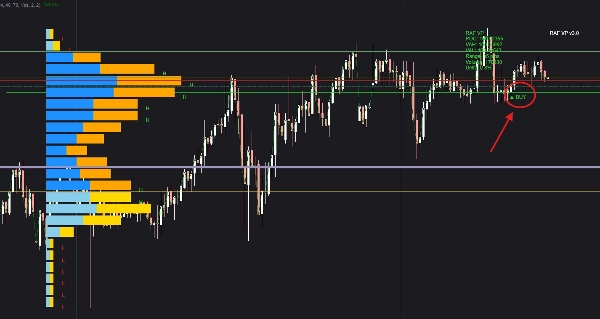
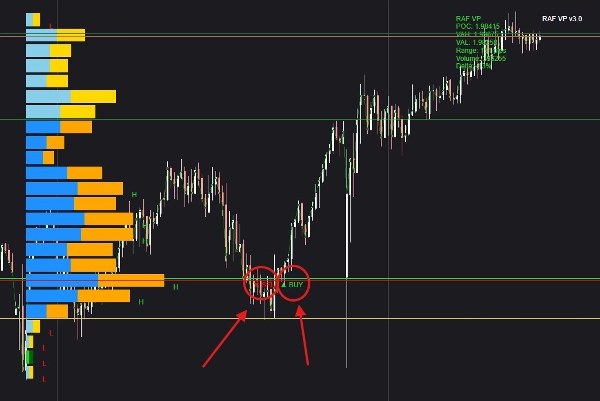
거래량이 집중된 위치를 매핑하기 위해 각 캔들을 분석하여 기관 투자자들이 활동하는 실제 구역을 드러냅니다. 실시간 볼륨 프로파일은 가격이 멈출 가능성이 있는 HVN 영역과 빠르게 돌파할 수 있는 LVN 영역을 보여줍니다. 델타 추적은 각 캔들 내에서 매수자 또는 매도자가 힘을 얻고 있는지를 드러냅니다. 가격이 POC, 불균형 구역 또는 주요 볼륨 선반과 상호작용할 때 시스템은 주문 흐름 행동을 평가하고 시장 통제의 변화에 따라 매수 또는 매도 신호를 생성합니다. 내장된 정보 창은 실시간 POC, 델타, 볼륨 수준 및 신호 조건을 표시하여 트레이더가 설정이 형성되는 이유와 그 강도를 즉시 확인할 수 있게 합니다. 이는 표준 지표보다 훨씬 더 정확하게 반전, 지속 설정 및 고확률 진입을 식별하는 데 도움을 줍니다.
요약
AI summary
Raf Volume Profile Pro v3.0 is an advanced volume-profile indicator designed to analyze each candle's trading volume distribution, highlighting zones of institutional activity. It identifies High Volume Nodes (HVN) where price tends to stall and Low Volume Nodes (LVN) where price can move rapidly. The tool tracks delta within candles to determine whether buyers or sellers are gaining strength. When price interacts with the Point of Control (POC), imbalance zones, or key volume shelves, the indicator assesses order flow and generates buy or sell signals based on shifts in market control. A built-in info window displays live POC, delta, volume levels, and signal conditions, providing real-time insight into the strength and formation of setups. This functionality supports identifying reversals, continuation patterns, and high-probability trade entries with greater precision than standard indicators. The product integrates concepts such as exponential moving averages (EMA), breaker blocks, key levels, imbalances, and support/resistance within its volume-based analysis framework. It outputs actionable signals including level touches, breaks, reversals, breakouts, and trend strength, relying on volume data as its primary input.
지표 프로필
지표 카테고리
거래량
출력 유형
신호
데이터 요구 사항
거래량
지원되는 신호
레벨 터치
레벨 돌파
추세 강도
돌파
반전
고객 리뷰
5.0
리뷰: 1
5 | 100 % | |
4 | 0 % | |
3 | 0 % | |
2 | 0 % | |
1 | 0 % |
고객 리뷰
October 4, 2026
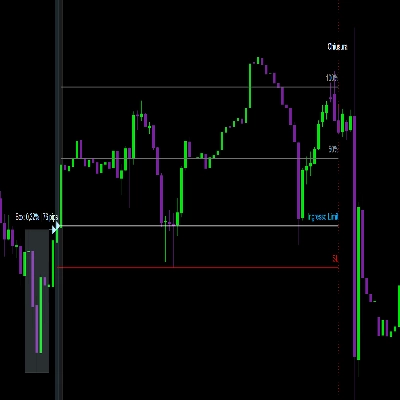
Raf Volume Profile Pro v3.0 provides clear volume histograms, POC and Value Area levels, Delta statistics, and BUY/SELL markers. Tested on EURUSD H1 and XAUUSD H1/M1, the indicator displayed consistently with a useful statistics panel. The layout is generally readable, although the profile can occupy part of the chart. A practical addition for discretionary volume analysis.
상담
자주 묻는 질문(FAQ)
EMA
Breaker Block
Key Levels
Imbalance
Volume
Support & Resistance
트레이딩 봇, 지표, 플러그인 등 cTrader Store에서 제공되는 상품은 제3자 개발자에 의해 제공되며, 이는 단순히 정보 및 기술적 접근을 목적으로 제공된 것입니다. cTrader Store는 중개인이 아니며, 투자 조언, 개인별 추천 또는 향후 성과에 대한 어떠한 보장도 제공하지 않습니다.
이 작성자의 상품 더 보기







가격
가입일 09/06/2026
4
판매