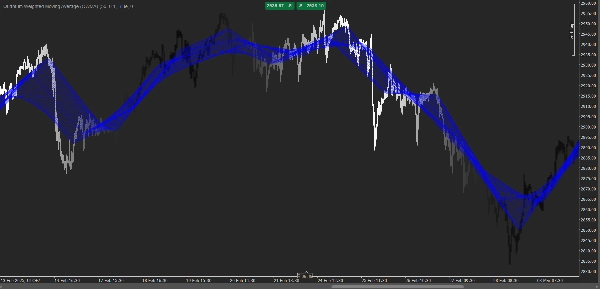
중개인 및 프랍
비즈니스용
00
Days
:
00
Hours
:
00
Minutes
:
00
Seconds
지표
Stocks
Forex
Crypto
Quantum Weighted Moving Average (QWMA)
03/09/2025
Desktop
가입일 04/03/2025
거래량
33.92M
핍 수익
296.61K
"Quantum Weighted Moving Average (QWMA)" 업로드된 이미지

Quantum Weighted Moving Average (QWMA)

The Quantum Weighted Moving Average (QWMA) is an advanced trading indicator designed to dynamically adjust the weighting of past prices based on market conditions. Unlike traditional moving averages that apply fixed weights, QWMA uses an adaptive exponential decay function to assign greater importance to recent price movements while still considering historical data.

Key Features:

Adaptive Weighting: Adjusts the influence of past prices based on volatility and trend strength.
Enhanced Sensitivity: Reacts faster to price changes compared to simple and exponential moving averages.
Noise Reduction: Helps filter out market noise while preserving trend clarity.
Customizable Parameters: Allows traders to modify decay factors and weighting functions to suit different trading strategies.

How It Works:

QWMA applies an exponential decay function to past price data, ensuring that older prices have diminishing influence while recent values contribute more significantly. This results in a smoother yet more responsive trend line that adapts to shifting market dynamics.

Ideal For:

📈 Trend Followers – Identify strong trends with minimal lag.
📉 Swing Traders – Detect market reversals earlier than standard moving averages.
💹 Scalpers – Gain quick insights into short-term momentum shifts.

QWMA is a powerful tool for traders seeking a balance between smoothness and responsiveness, making it suitable for various financial markets, including stocks, forex, and crypto trading. 🚀

0.0
리뷰: 0
고객 리뷰
이 상품에 대한 리뷰가 아직 없습니다. 이미 사용해 보셨나요? 다른 사람들에게 가장 먼저 소개해 주세요!
이 작성자의 상품 더 보기
지표
Scalping
ACTO-v1
ACTO: Oscillator tracking average candle duration to anticipate volatility shifts in trading.
좋아하실 만한 다른 항목
지표
Signal
FairValueGap-PremiumVersion1
This Fair Value Gap (FVG) indicator is a technical analysis on multi-timeframe.
지표
Indices
Forex
EURUSD
+2
US Dollar Index
US Dollar Index
지표
ZigZag
Indices
Breakout
+1
Auto Tools Suite
Auto Trendlines, Fibonacci, Pitchfork and Patterns from non‑repainting pivots. One‑click Presets, targeted Alerts, and a
지표
Breakout
BreakOut_Probability_Expo
Break Out Probability Experimental indicator. Credits for this indicator goes to Zeiierman !!!
지표
Forex
VegaXLR - Candlestick Patterns Alerts
Real-Time Candlestick Pattern Detection with Custom Alerts & Trend Analysis for cTrader
지표
Indices
Stocks
Commodities
+2
Instantaneous Trendline
John Ehlers' trendline using signal processing to filter cycle noise and identify trends with minimal lag.
지표
NAS100
NZDUSD
XAUUSD
+15
VWAP_MTF
📊 VWAP with MTF & Dynamic Deviation Bands
지표
Grid
Breakout
XAUUSD
+10
Ultimate Trend ADX
Download Ultimate Trend ADX today and experience a smarter way to track market trends completely free on ctrader
Clarosti
Clarosti a chave para decisões inteligentes no mercado
지표
NAS100
XAUUSD
FVG
+4
Simple ICT Concepts
Simple ICT Concepts
Dhruvin Wick Candelssss
RSI‑powered robot for high‑volatility scalping, no fuss.
지표
Stocks
Forex
Crypto
+1
Market Structure SNR + Auto Bias
Market Structure Indicator – Your Trading Map in a Noisy Market. No more Panicking Which one, Where, Why and How.
지표
Indices
Commodities
Stocks
+2
MARainbow
MARainbow gives you the edge with four customizable moving averages—each color-coded for instant recognition.
지표
NAS100
XAUUSD
FVG
+6
Fair Value Gaps
The Fair Value Gap (FVG) Indicator identifies inefficiencies in price action where an imbalance occurs due to aggressive
지표
Indices
Breakout
Stocks
+3
Ichimoku Cloud Indicator
The Ichimoku Cloud is a comprehensive technical analysis system developed by Japanese journalist Goichi Hosoda
지표
Breakout
ATR
Signal
+3
Support Resistance Indicator
A custom support resistance indicator, specifically designed for scalping techniques.
지표
NAS100
Indices
NZDUSD
+9
SUPER TREND Oscillatore
지표
VWAP
ZigZag
RSI
+6
RSI T3 Overbought and oversold areas
Three parameter RSI