
설명
다크 클라우드 커버 지표는 시장에서 잠재적인 약세 반전 패턴을 식별하기 위해 설계된 기술적 분석 도구입니다. 이 패턴은 두 개의 연속된 캔들스틱으로 구성됩니다:
- 강한 매수 모멘텀을 나타내는 강세(녹색) 캔들.
- 이전 종가 위에서 시작하지만 이전 캔들의 중간점 아래에서 마감하는 약세(빨간색) 캔들로, 매도 압력을 나타냅니다.
이 형성은 매수세가 힘을 잃고 매도세가 주도권을 잡는 시장 심리의 잠재적 변화를 시사합니다.
특징 및 기능:
- 패턴 감지:
-
- 이 지표는 캔들스틱 가격 움직임을 기반으로 다크 클라우드 커버 패턴을 스캔합니다.
- 패턴이 감지되면 거래자에게 알리기 위해 시각적으로 강조 표시합니다.
- 추세 필터 (선택 사항):
-
- 정확도를 높이기 위해 이 지표는 이동 평균(MA)를 사용하는 선택적 추세 필터를 포함합니다.
- 활성화되면, 패턴은 상승 추세에서만 유효한 것으로 간주됩니다.
- 확인 논리:
-
- 이 지표는 다음 캔들을 확인하여 약세 신호를 검증할 수 있습니다.
- 확인 캔들은 다크 클라우드 커버 저점 아래에서 마감하고 최근 캔들 평균보다 높은 틱 거래량을 가진 경우로 식별됩니다.
- 이것은 신호의 신뢰성을 높여줍니다.
- 시각적 표시기:
-
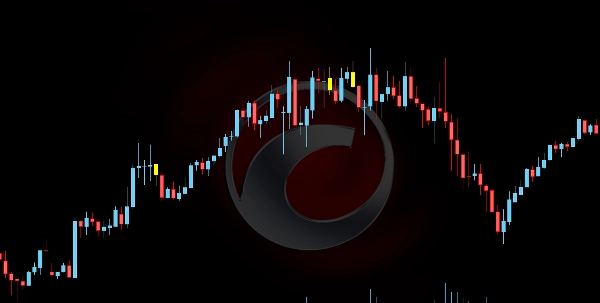
- 노란색 캔들: 감지된 다크 클라우드 커버 패턴을 표시합니다.
- 주황색 캔들: 거래량 조건이 충족되면 확인 캔들을 강조 표시합니다.
이 지표는 거래자가 높은 확률의 반전 설정을 포착하도록 도와주어, 숏 진입이나 리스크 관리 전략에 대한 의사결정을 개선합니다.
요약
AI 요약
The Dark Cloud Cover indicator is a technical analysis tool that identifies a specific bearish reversal candlestick pattern. This pattern consists of two candles: a bullish (green) candle indicating strong buying momentum, followed by a bearish (red) candle that opens above the previous close but closes below the midpoint of the prior candle, signaling selling pressure and a potential shift from buyers to sellers.
Key features include:
- **Pattern Detection:** Automatically scans for the Dark Cloud Cover pattern based on candlestick price action and visually highlights detected patterns for trader awareness.
- **Optional Trend Filter:** Incorporates a Moving Average (MA) filter to validate patterns only during uptrends, enhancing signal accuracy.
- **Confirmation Logic:** Validates bearish signals by analyzing the subsequent candle, which must close below the pattern’s low with higher-than-average tick volume to confirm the reversal.
- **Visual Markers:** Uses yellow candles to mark detected patterns and orange candles to highlight confirmation candles meeting volume criteria.
This indicator assists traders in recognizing high-probability bearish reversal setups, supporting decision-making for short entries and risk management strategies.
지표 프로필
고객 리뷰
0.0
리뷰: 0
고객 리뷰
이 상품에 대한 리뷰가 아직 없습니다. 이미 사용해 보셨나요? 다른 사람들에게 가장 먼저 소개해 주세요!
상담
자주 묻는 질문(FAQ)
Signal
트레이딩 봇, 지표, 플러그인 등 cTrader Store에서 제공되는 상품은 제3자 개발자에 의해 제공되며, 이는 단순히 정보 및 기술적 접근을 목적으로 제공된 것입니다. cTrader Store는 중개인이 아니며, 투자 조언, 개인별 추천 또는 향후 성과에 대한 어떠한 보장도 제공하지 않습니다.
이 작성자의 상품 더 보기


!["[Stellar Strategies] Market Regime Filter" 로고](https://cdn.ctrader.com/image/webp/3bdeba11-7e8b-4e5f-9af9-d562f48df039_28423)


가격
5
판매
436
무료 설치