
Descrizione
📌 Caratteristiche e funzionalità
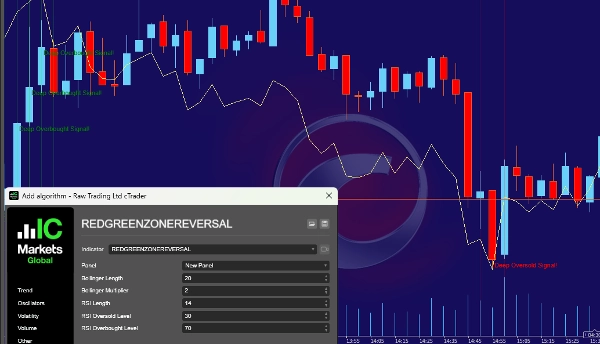
- Bande di Bollinger (SMA a 20 periodi con deviazione standard di 2)
-
- Banda superiore: Indica livelli di ipercomprato.
- Banda inferiore: Indica livelli di ipervenduto.
- Indice di forza relativa (RSI) (14 periodi)
-
- RSI sopra 70 → Il mercato è ipercomprato (pressione d'acquisto eccessiva).
- RSI sotto 30 → Il mercato è ipervenduto (pressione di vendita eccessiva).
- Rileva zone di inversione:
-
- Zona rossa (ipervenduto):
-
- Il prezzo di chiusura è sotto la banda inferiore di Bollinger.
- RSI è sotto 30 (forte pressione di vendita).
- Significato: Il mercato è ipervenduto, un'opportunità di acquisto potenziale.
- Zona verde (ipercomprato):
-
- Il prezzo di chiusura è sopra la banda superiore di Bollinger.
- RSI è sopra 70 (forte pressione d'acquisto).
- Significato: Il mercato è ipercomprato, un'opportunità di vendita potenziale.
- Indicatori visivi sul grafico:
-
- Zona ombreggiata in rosso quando ipervenduto (potenziale opportunità di acquisto).
- Zona ombreggiata in verde quando ipercomprato (potenziale opportunità di vendita).
- Avvisi e segnali sonori:
-
- Testo appare sul grafico (“Segnale di ipervenduto profondo!” o “Segnale di ipercomprato profondo!”).
- Notifiche sonore si attivano quando viene rilevata una condizione di ipercomprato/ipervenduto.
🎯 Come aiuta questo indicatore i trader?
✅ Fornisce segnali di avviso per potenziali inversioni di mercato (a livelli di prezzo estremi).
✅ Aiuta i trader a trovare punti di ingresso e uscita forti.
✅ Combina Bande di Bollinger e RSI per una affidabile rilevazione di ipercomprato/ipervenduto.
✅ Adatto per day trading, swing trading e scalping su diversi timeframe.
🚀 Riepilogo:
Questo indicatore aiuta a identificare condizioni di ipercomprato e ipervenduto e avvisa quando è probabile un'inversione di prezzo. I trader possono usarlo per prendere decisioni intelligenti di acquisto e vendita!
🚨 Disclaimer sul rischio di trading 🚨
Il trading di strumenti finanziari, inclusi azioni, forex, criptovalute, materie prime e derivati, comporta un alto livello di rischio e non è adatto a tutti gli investitori. Prima di intraprendere qualsiasi forma di trading, è essenziale comprendere i rischi coinvolti e considerare attentamente la propria situazione finanziaria, esperienza e tolleranza al rischio.
I mercati possono essere altamente volatili e i movimenti di prezzo possono essere improvvisi e imprevedibili a causa di dati economici, eventi geopolitici, sentiment di mercato o notizie inaspettate. Questa volatilità può portare a guadagni sostanziali, ma anche a perdite significative. I mercati possono muoversi rapidamente contro la tua posizione, gli stop-loss e le strategie di gestione del rischio non garantiscono la prevenzione delle perdite, e la leva finanziaria può amplificare sia guadagni che perdite, potenzialmente superando il tuo investimento iniziale.
Non ci sono garanzie che qualsiasi strategia di trading, indicatore tecnico o metodo porterà a profitti. Le performance storiche non garantiscono risultati futuri, e il successo passato non assicura guadagni futuri. Anche i trader professionisti subiscono perdite, le condizioni di mercato cambiano costantemente e prevedere i movimenti futuri con certezza è impossibile. Il trading non dovrebbe mai basarsi esclusivamente su speculazioni o emozioni.
L'uso della leva o del trading a margine consente di controllare posizioni più grandi con un investimento di capitale minore, ma aumenta significativamente il rischio. La leva può portare a una rapida perdita di capitale, le chiamate di margine possono costringere alla liquidazione di posizioni a prezzi sfavorevoli, e il trading a margine può comportare la perdita di più denaro rispetto a quanto inizialmente depositato. Inoltre, possono verificarsi rischi di liquidità e slippage, il che significa che potrebbero non esserci abbastanza acquirenti o venditori in un dato momento, e gli ordini potrebbero non essere eseguiti ai prezzi previsti. I gap di mercato possono causare salti improvvisi di prezzo, bypassando completamente i livelli di stop-loss.
Il trading richiede disciplina, pazienza e controllo emotivo. Paura, avidità e eccessiva fiducia spesso portano a decisioni di trading sbagliate, aumentando la probabilità di perdite. Il trading emotivo può causare decisioni impulsive e irrazionali, mentre la paura di perdere un'opportunità (FOMO) e il trading di rivalsa possono portare a rischi eccessivi. È fondamentale sviluppare una strategia chiara e attenersi a un piano di gestione del rischio.
Devono essere considerati anche i rischi normativi e legali, poiché diverse giurisdizioni hanno regolamentazioni differenti riguardo al trading e agli investimenti. Alcuni prodotti finanziari potrebbero non essere disponibili nel tuo paese, e i cambiamenti normativi possono influenzare le condizioni di mercato. Assicurati sempre di rispettare le leggi locali e le normative finanziarie, fai trading con broker o exchange affidabili e regolamentati, ed evita piattaforme non regolamentate che possono comportare rischi finanziari significativi.
I rischi legati alla tecnologia non devono essere trascurati, poiché il trading dipende fortemente dalle piattaforme di trading, dalla connettività internet e dall'esecuzione del software. Ritardi nell'esecuzione dovuti a internet lento o problemi del server possono causare perdite inaspettate, guasti di sistema possono far sì che le posizioni rimangano aperte più a lungo del previsto, e esistono rischi di sicurezza informatica quando si utilizzano piattaforme di trading online.
È importante notare che tutte le informazioni di trading, indicatori, segnali o strumenti sono solo a scopo educativo e non devono essere considerati come consigli finanziari. I trader dovrebbero condurre le proprie ricerche e, se necessario, consultare un consulente finanziario autorizzato prima di prendere decisioni di investimento. Nessun indicatore o strategia garantisce profitti costanti, e la responsabilità di tutte le decisioni di trading ricade esclusivamente sul singolo trader.
La regola più importante nel trading è di non operare mai con soldi che non puoi permetterti di perdere. Il trading è intrinsecamente rischioso e le perdite possono superare gli investimenti iniziali. Opera solo con reddito disponibile che sei disposto a perdere, non usare mai denaro preso in prestito o destinato a spese essenziali, e diversifica i tuoi investimenti per evitare di mettere tutti i fondi in un singolo trade o asset.
Il trading è un'attività ad alto rischio e non dovrebbe essere considerata come fonte primaria di reddito. Molti trader perdono denaro, e solo una piccola percentuale raggiunge la redditività a lungo termine. Prendi decisioni informate, gestisci i rischi e fai sempre trading responsabilmente. Utilizzando qualsiasi piattaforma di trading, strumenti o indicatori, riconosci e accetti i rischi associati al trading.
Fai trading responsabilmente. Rimani informato. Proteggi il tuo capitale. 🚀
Riepilogo
- Red Zone (Oversold): Closing price below the lower Bollinger Band and RSI below 30, signaling strong selling pressure and a potential buying opportunity.
- Green Zone (Overbought): Closing price above the upper Bollinger Band and RSI above 70, indicating strong buying pressure and a potential selling opportunity.
Visual markers include red-shaded zones for oversold conditions and green-shaded zones for overbought conditions. Alerts are provided via on-chart text notifications ("Deep Oversold Signal!" or "Deep Overbought Signal!") and sound signals when these conditions occur.
This tool assists traders by providing warning signals for potential market reversals at extreme price levels, helping to identify strong entry and exit points. It is suitable for various trading styles, including day trading, swing trading, and scalping, across different timeframes. The indicator supports markets such as forex, stocks, indices, and commodities.
Recensioni dei clienti
5 | 100 % | |
4 | 0 % | |
3 | 0 % | |
2 | 0 % | |
1 | 0 % |


