
Penerangan
// ══════════════════════════════════════ ══════════════════════════════════════
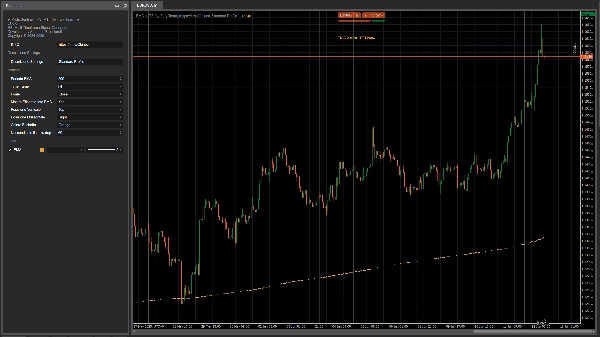
// 📊 PENUNJUK EMA PADA TF (MULTI-TIMEFRAME)
// Versi: 1.0.0 - Penunjuk profesional untuk analisis multi-timeframe
// Pengarang: Pasukan Fury - Armando Brecciaroli
// Tarikh: 5 Jun 2025
// ══════════════════════════════════════════════════════════════════════════
//
// PERIHAL:
// ===========
// EMA pada TF adalah penunjuk lanjutan yang memaparkan purata bergerak eksponen
// (EMA) yang dikira pada jangka masa tertentu dan diproyeksikan ke atas
// jangka masa carta semasa. Alat ini membolehkan anda menggunakan purata bergerak dari jangka masa yang lebih tinggi
// (contohnya H4, D1) walaupun pada carta dengan jangka masa lebih rendah (M15, H1),
// membolehkan analisis multi-timeframe yang lengkap dan segera.
//
// CIRI-CIRI UTAMA:
// ==========================
// - Paparan EMA dari mana-mana jangka masa pada carta semasa
// - Sokongan penuh untuk semua jangka masa yang tersedia dalam cTrader
// - Penyesuaian penuh tempoh EMA dan sumber harga
// - Pengurusan label maklumat dengan penempatan yang fleksibel
// - Sistem pelesenan yang selamat dan pemeriksaan kemas kini automatik
// - Dioptimumkan sepenuhnya untuk prestasi tinggi walaupun pada set data besar
// - Penyesuaian penuh penampilan visual (warna, gaya garis)
//
// GUNAAN PRAKTIKAL:
// ================
// - Kenal pasti tren jangka panjang pada carta jangka masa lebih rendah
// - Paparkan purata penting dari jangka masa lebih tinggi
// - Cipta strategi multi-timeframe berdasarkan purata bergerak
// - Kenal pasti sokongan dan rintangan dinamik yang lebih boleh dipercayai
//
// LOG PERUBAHAN:
// =========
// v1.0.0 (05/06/2025)
// - Pelepasan awal dengan sokongan penuh untuk semua jangka masa
// - Pelaksanaan sistem pengurusan lesen lanjutan
// - Antara muka pengguna yang boleh disesuaikan dengan HUD informatif
// - Ditambah label informatif pada carta
// - Sistem kemas kini automatik yang terintegrasi
// - Pengoptimuman prestasi untuk siri masa yang panjang
// - Sokongan untuk semua sumber harga (Tutup, Buka, Tinggi, Rendah, dll.)
// - Pengurusan automatik paparan mesej sistem
// ═══════════════════════════════════════════════════════════════════════════════
Untuk mengaktifkan lesen, ikut maklumat pada skrin atau dalam log.
Ringkasan
Ulasan pelanggan
5 | 0 % | |
4 | 100 % | |
3 | 0 % | |
2 | 0 % | |
1 | 0 % |


