Penerangan
The ZLEMA (Zero Lag Exponential Moving Average) adalah versi lanjutan bagi Purata Pergerakan Eksponen (EMA) yang direka untuk mengurangkan kelewatan yang biasanya dikaitkan dengan EMA tradisional. Dengan menggunakan kaedah pengiraan khusus, ZLEMA bertindak balas dengan lebih cepat terhadap perubahan harga, menjadikannya sangat berkesan dalam pasaran yang tidak stabil.
Ciri utama ZLEMA ialah ciri "kelewatan sifar" yang membolehkannya mengikuti pergerakan harga dengan lebih dekat, terutamanya dalam keadaan pasaran yang bergerak pantas. Berbanding dengan EMA tradisional, ZLEMA menawarkan masa tindak balas yang lebih pantas, menjadikannya lebih tepat pada masanya dalam menangkap tren pasaran.
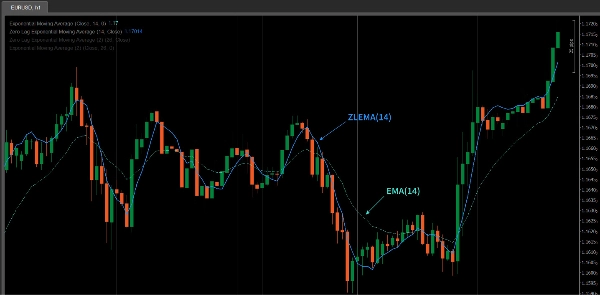
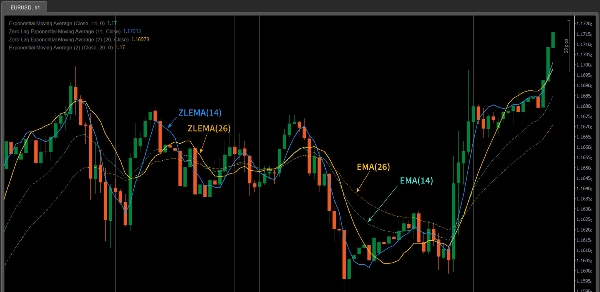
ZLEMA vs EMA
- Response Speed: ZLEMA bertindak balas lebih cepat daripada EMA tradisional. Dengan mengimbangi kelewatan, ia mengikuti perubahan harga dengan lebih segera.
- Smoothing Effect: ZLEMA mengekalkan kesan pelicinan yang serupa dengan EMA, sambil meminimumkan kelewatan harga, menjadikannya lebih sesuai untuk pasaran yang bergerak pantas.
- Use Case: Jika anda berdagang dalam pasaran yang sangat tidak stabil (seperti perdagangan jangka pendek atau intrahari), ZLEMA boleh mengatasi EMA dari segi kepekaan tindak balas.
Ciri-ciri Penunjuk ZLEMA
- Zero Lag Response: ZLEMA mengurangkan kelewatan, membolehkannya bertindak balas dengan cepat terhadap turun naik harga pasaran, menjadikannya lebih tepat untuk menangkap perubahan pasaran yang pantas.
- Smoothness: Walaupun menawarkan tindak balas yang lebih pantas, ZLEMA mengekalkan kesan pelicinan EMA, membantu mengelakkan gangguan yang disebabkan oleh turun naik harga.
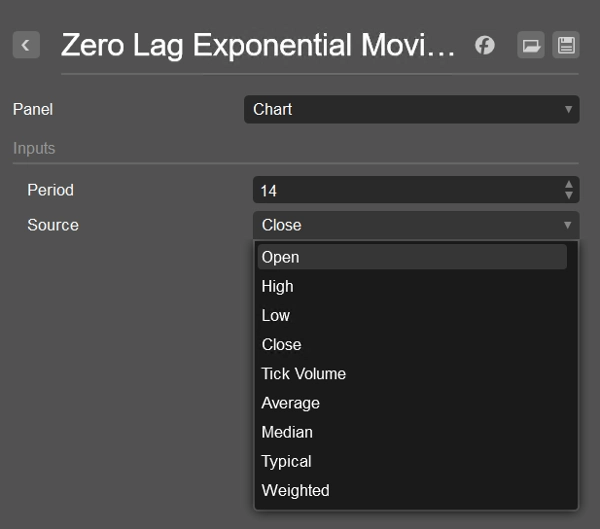
- Flexibility: ZLEMA boleh digunakan dengan pelbagai sumber data harga (seperti
Close,Open,High, dan lain-lain), membolehkan pedagang menyesuaikannya berdasarkan keperluan strategi mereka. - Trend Following and Reversal Signal Confirmation: ZLEMA sesuai untuk mengenal pasti perubahan tren, terutamanya dalam pasaran yang tidak stabil, dan mengesahkan isyarat pembalikan harga.
Cara Menggunakan Penunjuk ZLEMA
- Short-Term Traders: ZLEMA sangat sesuai untuk pedagang jangka pendek kerana ia boleh bertindak balas dengan cepat terhadap turun naik harga. Tindak balas pantasnya menjadikannya ideal untuk menangkap pembalikan tren jangka pendek atau isyarat pecahan.
- Trend Following: ZLEMA juga boleh digunakan untuk menjejaki tren jangka panjang tetapi menawarkan kepekaan lebih tinggi berbanding EMA. Dalam tren yang kuat, ZLEMA membantu mengenal pasti permulaan atau akhir tren dengan lebih cepat, membantu dalam penyesuaian strategi tepat pada masanya.
- Combining with Other Indicators: ZLEMA berfungsi dengan baik apabila digabungkan dengan penunjuk teknikal lain seperti RSI, MACD, atau analisis corak harga untuk meningkatkan ketepatan isyarat. Ia sangat berguna apabila digabungkan dengan penunjuk mengikuti tren seperti purata bergerak untuk mengesahkan pecahan harga atau pembalikan.
- Confirming Breakouts and Reversals: ZLEMA boleh membantu mengesahkan pecahan harga dari tahap utama atau isyarat pembalikan. Contohnya, apabila harga melintasi garis ZLEMA, ia boleh menunjukkan perubahan tren, dan sebaliknya.
- Noise Reduction: Disebabkan oleh pengurangan kelewatan, ZLEMA lebih baik dalam menapis gangguan yang mungkin terdapat dalam purata bergerak tradisional, menjadikannya alat penting dalam perdagangan intrahari atau pasaran yang sangat tidak stabil.
Petua untuk Menggunakan ZLEMA
- Adjust the Period: Laraskan tempoh ZLEMA berdasarkan gaya perdagangan dan volatiliti pasaran anda. Untuk perdagangan jangka pendek, gunakan tempoh yang lebih pendek (contohnya, 10 atau 14), manakala untuk penjejakan tren jangka panjang, tempoh yang lebih panjang (contohnya, 50 atau 100) mungkin lebih sesuai.
- Combine with Other Tools: Walaupun ZLEMA menyediakan keupayaan mengikuti tren yang sangat baik, menggabungkannya dengan penunjuk lain seperti RSI untuk keadaan terlebih beli/terlebih jual atau MACD untuk kekuatan tren boleh meningkatkan ketepatan.
- Testing and Optimization: Prestasi ZLEMA mungkin berbeza mengikut keadaan pasaran yang berbeza. Disarankan untuk menguji semula dan mengoptimumkannya dengan teliti sebelum menggunakannya dalam perdagangan langsung untuk memastikan hasil terbaik dalam strategi anda.
Ringkasan
Key features include:
- Zero lag response for timely reaction to price fluctuations.
- Smoothness that filters out noise without sacrificing responsiveness.
- Flexibility to use various price data inputs such as Close, Open, or High prices.
- Utility in trend following and confirming reversal signals.
ZLEMA is particularly useful for short-term traders seeking to capture rapid trend reversals or breakouts, as well as for longer-term trend tracking with enhanced sensitivity compared to EMA. It can be combined with other indicators like RSI or MACD to improve signal accuracy and confirm price breakouts or reversals.
Users can adjust the indicator’s period to match their trading style and market conditions, optimizing performance through backtesting. ZLEMA helps reduce noise and lag, making it a valuable tool for intraday and volatile market trading.