

Penerangan
HARI PERCUBAAN OSCILLATOR SUPER TREND15
"PERHATIAN," DALAM VERSI BERBAYAR VERSI PERCUBAAN PERCUMA 15-HARI JUGA TERSEDIA" klik pada produk berbayar dan anda akan menemui versi percuma-
Oscillator SuperTrend Ringkas - Penerangan Lengkap
Gambaran Keseluruhan
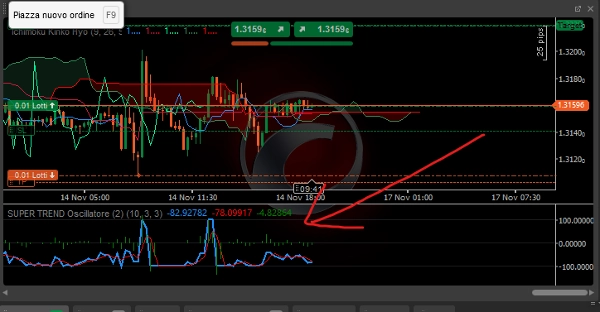
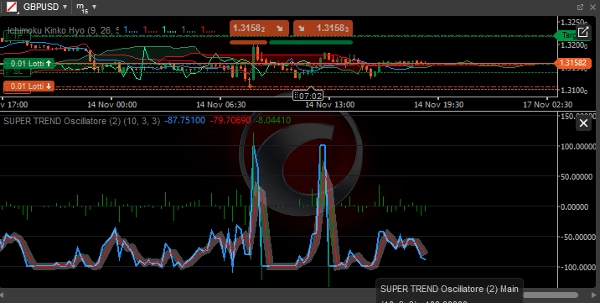
Oscillator SuperTrend Ringkas adalah penunjuk teknikal maju untuk cTrader yang mengubah SuperTrend klasik menjadi oscillator visual, memudahkan pengenalpastian arah, kekuatan, dan kebolehpercayaan trend.
Komponen Utama
1. Garis Utama (Biru)
- Fungsi: Menunjukkan jarak dinormalisasi antara harga dan garis SuperTrend
- Pengiraan:
((Price - SuperTrend) / (ATR × Multiplier)) × 100 - Tafsiran:
-
- > 0: Trend menaik (harga di atas SuperTrend)
- < 0: Trend menurun (harga di bawah SuperTrend)
- Julat: Dari -100 hingga +100
2. Garis Isyarat (Merah)
- Fungsi: Purata bergerak mudah bagi garis utama
- Tempoh: Boleh disesuaikan (default 3 tempoh)
- Penggunaan: Menapis bunyi pasaran dan mengesahkan isyarat
3. Histogram (Kelabu)
- Fungsi: Perbezaan antara garis utama dan garis isyarat
- Tafsiran:
-
- Positif: Momentum menaik semakin laju
- Negatif: Momentum menurun semakin laju
- Persilangan sifar: Potensi pembalikan momentum
Parameter Boleh Disesuaikan
Parameter SuperTrend:
- Tempoh ATR: Tempoh untuk pengiraan Julat Benar Purata (default: 10)
- Pengganda: Pengganda untuk jalur SuperTrend (default: 3.0)
Parameter Oscillator:
- Tempoh Isyarat: Tempoh untuk garis isyarat (default: 3)
Tafsiran Isyarat
Keadaan Trend:
- Trend Menaik Kuat:
-
- Utama > +50
- Utama > Isyarat
- Histogram positif
- Trend Menurun Kuat:
-
- Utama < -50
- Utama < Isyarat
- Histogram negatif
- Pasaran Mendatar:
-
- Utama antara -30 dan +30
- Sering berlaku persilangan garis
Isyarat Perdagangan:
Masuk Panjang:
- Utama melintasi ke atas 0
- Histogram menjadi positif
- Garis isyarat mengesahkan kenaikan
- Utama di atas +20 untuk momentum
Masuk Pendek:
- Utama melintasi ke bawah 0
- Histogram menjadi negatif
- Garis isyarat mengesahkan penurunan
- Utama di bawah -20 untuk momentum
Keluar/Ambil Untung:
- Panjang: Utama > +80 (terbeli berlebihan) atau melintasi ke bawah Isyarat
- Pendek: Utama < -80 (terjual berlebihan) atau melintasi ke atas Isyarat
Kelebihan Versi Ringkas
1. Prestasi Dioptimumkan
- Pengiraan lebih cekap
- Penggunaan sumber lebih rendah
- Respons lebih pantas terhadap perubahan harga
2. Kemudahan Penggunaan
- Parameter penting dikurangkan
- Isyarat visual segera
- Tafsiran mudah walaupun untuk pedagang pemula
3. Kebolehpercayaan
- Kurang terdedah kepada bunyi
- Isyarat lebih bersih dan jelas
- Isyarat palsu dikurangkan berbanding SuperTrend klasik
Strategi Penggunaan
Strategi Mengikuti Trend:
- Masuk: Utama > 0 untuk panjang, Utama < 0 untuk pendek
- Penapis: Histogram tanda sama dengan Utama
- Keluar: Pembalikan tanda atau tahap ekstrem dicapai
Strategi Momentum:
- Masuk: Utama > +30 (panjang) atau Utama < -30 (pendek)
- Pengesahan: Histogram semakin laju
- Keluar: Momentum melambat (histogram menurun)
Strategi Pembalikan Purata:
- Masuk: Utama > +80 (pendek) atau Utama < -80 (panjang)
- Pengesahan: Pembalikan histogram
- Keluar: Kembali ke zon neutral
Keadaan Pasaran Optimum
Pasaran Trend:
- Kecekapan tinggi
- Isyarat berpanjangan
- Kurang whipsaw
Pasaran Mendatar:
- Kurangkan saiz lot
- Lanjutkan jangka masa
- Gunakan sebagai penapis momentum
Amalan Terbaik
Jangka Masa Disyorkan:
- Intrahari: M15 - H1
- Swing Trading: H4 - D1
- Perdagangan Posisi: W1 - MN
Pengurusan Risiko:
- Stop Loss: 1.5-2 × ATR
- Ambil Untung: 2-3 × Risiko
- Saiz Posisi: 1-2% setiap dagangan
Pengesahan Tambahan:
- Penjajaran pelbagai jangka masa
- Pengesahan volum
- Tahap sokongan/rintangan utama
Keterbatasan
Pertimbangan:
- Kelewatan semula jadi (penunjuk mengikuti trend)
- Prestasi berkurang dalam pasaran mendatar
- Perlukan pengesahan dalam volatiliti rendah
Cadangan:
- Gabungkan dengan analisis tindakan harga
- Gunakan sebagai penapis, bukan sistem berdiri sendiri
- Uji demo sebelum penggunaan langsung
Oscillator ini mewakili alat yang kuat untuk mengenal pasti trend kuat dan menapis isyarat palsu sambil mengekalkan kesederhanaan operasi yang sesuai untuk pedagang pemula dan berpengalaman.
Ringkasan
Ulasan pelanggan
5 | 0 % | |
4 | 100 % | |
3 | 0 % | |
2 | 0 % | |
1 | 0 % |


