
Penerangan
VOLUME HEATMAP PRO - Visualisasi Ketumpatan Pasaran Profesional
Lihat pasaran seperti tidak pernah sebelum ini dengan heatmap volum canggih ini yang mengubah data volum yang kompleks menjadi paparan visual yang intuitif. Berbeza dengan penunjuk volum tradisional yang hanya menunjukkan bar di bahagian bawah carta anda, Volume Heatmap Pro mendedahkan dengan tepat di mana pedagang institusi mengumpul dan mengagihkan posisi di setiap tahap harga.
CIRI-CIRI UTAMA:
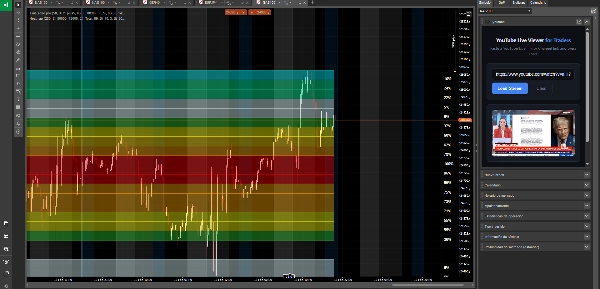
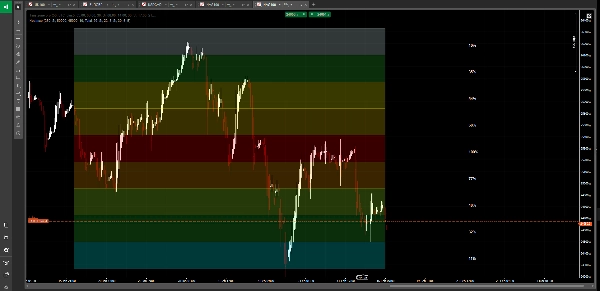
🔥 Heatmap Berwarna Dinamik
Alami analisis volum melalui sistem gradasi warna 10 peringkat yang menakjubkan. Dari biru sejuk (aktiviti minimum) ke merah menyala (volum maksimum), kenal pasti dengan segera di mana aliran wang besar berlaku. Heatmap dikemas kini secara masa nyata, menunjukkan ketumpatan pasaran dengan sekilas pandang.
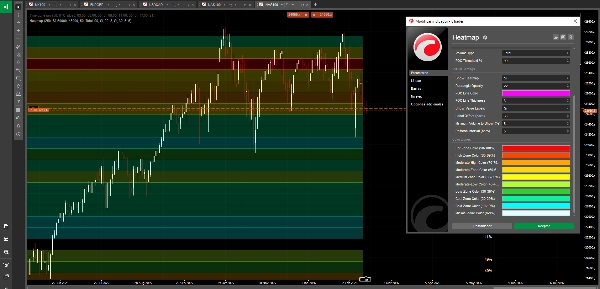
📍 Pengesanan Titik Kawalan (POC)
Secara automatik mengenal pasti dan menyerlahkan tahap harga dengan volum dagangan tertinggi - titik keseimbangan sebenar pasaran. Di sinilah institusi telah membina posisi terbesar mereka dan di mana harga cenderung kembali.
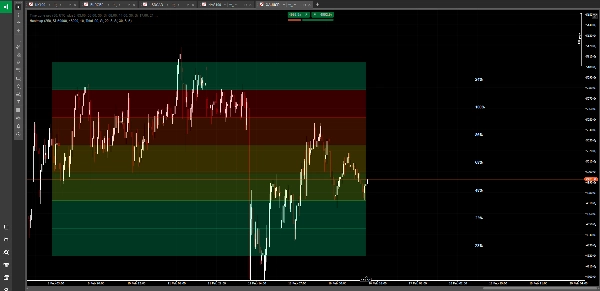
🎯 Pengagihan Volum Berbilang Tahap
Membahagikan julat harga anda kepada sehingga 50 tahap tepat, mencipta peta terperinci pengagihan volum. Lihat dengan tepat harga mana yang menarik dagangan berat dan mana yang diabaikan oleh pasaran.
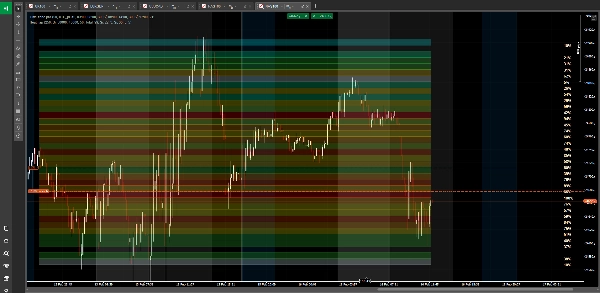
📊 Tiga Mod Analisis Volum
• Jumlah Volum - Lihat semua aktiviti pasaran
• Volum Beli Sahaja - Pisahkan zon tekanan bullish
• Volum Jual Sahaja - Kenal pasti kawasan pengagihan bearish
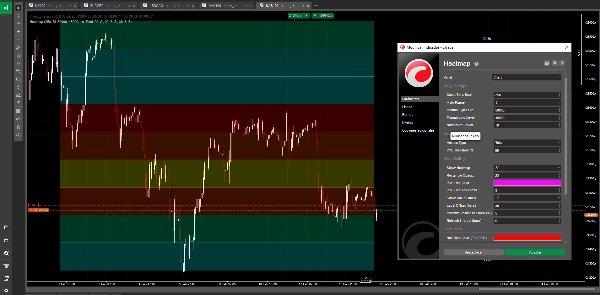
🎨 Visualisasi Profesional
• Segi empat berwarna yang merangkumi tempoh analisis anda
• Ketelusan boleh laras untuk integrasi carta yang sempurna
• Label peratusan volum pilihan pada setiap tahap
• Garis POC boleh disesuaikan dengan kawalan ketebalan
• Paparan bersih, tidak mengganggu
⚙️ Teknologi Julat Auto Pintar
Secara automatik mengira julat harga optimum dari tempoh tinjauan anda, atau tentukan julat anda sendiri secara manual untuk analisis khusus. Heatmap menyesuaikan diri dengan sebarang keadaan pasaran atau jangka masa.
🔄 Prestasi Dioptimumkan
Selang penyegaran yang boleh dikonfigurasikan memastikan prestasi carta yang lancar sambil mengekalkan analisis volum yang tepat. Analisis sehingga 500 bar ke belakang tanpa kelewatan.
📈 Zon Warna Boleh Disesuaikan
Personalisasikan semua 10 zon warna untuk menyesuaikan dengan keutamaan visual anda:
• Zon Panas (90-100%) - Kepekatan volum maksimum
• Zon Tinggi (80-89%) - Aktiviti kuat
• Sederhana-Tinggi (70-79%) - Volum di atas purata
• Sederhana (60-69%) - Aktiviti kukuh
• Sederhana (50-59%) - Volum purata
• Sederhana-Rendah (40-49%) - Di bawah purata
• Zon Rendah (30-39%) - Aktiviti ringan
• Zon Sejuk (20-29%) - Dagangan minimum
• Zon Sejuk (10-19%) - Volum sangat ringan
• Minimum (0-9%) - Hampir tiada aktiviti
SEMPURNA UNTUK:
• Mengenal pasti zon pengumpulan dan pengagihan institusi
• Mencari nod volum rendah untuk kawasan potensi pecahan
• Mengenal pasti tahap sokongan dan rintangan volum tinggi
• Memahami struktur pasaran dan kecairan
• Mengesahkan kemasukan dagangan di kawasan volum tinggi
• Mengelakkan zon perangkap kecairan rendah
• Analisis profil volum berbilang jangka masa
APA YANG MEMBEZAKANNYA:
Penunjuk volum tradisional menunjukkan berapa BANYAK yang didagangkan, tetapi bukan DI MANA. Volume Heatmap Pro mendedahkan gambaran lengkap - peta ketumpatan visual yang menunjukkan dengan tepat tahap harga mana yang menyerap aktiviti dagangan paling banyak. Sistem warna gradasi menjadikan analisis volum yang kompleks semudah membaca peta cuaca. Merah bermaksud panas (volum berat), biru bermaksud sejuk (volum ringan).
Sama ada anda melakukan scalping pembalikan intrahari atau meletakkan posisi untuk dagangan ayunan, heatmap ini menunjukkan di mana pasaran mempunyai keyakinan sebenar berbanding di mana ia hanya bunyi bising.
---
⚠️ PENAFIAN RISIKO:
Perdagangan pertukaran asing, mata wang kripto, dan instrumen kewangan lain membawa tahap risiko yang tinggi dan mungkin tidak sesuai untuk semua pelabur. Tahap leverage yang tinggi boleh memberi kesan negatif serta positif kepada anda. Sebelum memutuskan untuk berdagang, anda harus mempertimbangkan dengan teliti objektif pelaburan, tahap pengalaman, dan selera risiko anda. Terdapat kemungkinan anda mengalami kerugian sebahagian atau keseluruhan pelaburan anda. Oleh itu, anda tidak harus melabur wang yang anda tidak mampu kehilangan. Anda harus sedar tentang semua risiko yang berkaitan dengan perdagangan dan mendapatkan nasihat daripada penasihat kewangan bebas jika anda mempunyai sebarang keraguan. Prestasi lalu tidak menunjukkan hasil masa depan.
Ringkasan
Key features include automatic Point of Control (POC) detection, highlighting the price level with the highest trading volume, and multi-level volume distribution dividing the price range into up to 50 levels for detailed analysis. It supports three volume modes: total volume, buy volume only, and sell volume only, enabling users to isolate bullish or bearish pressure zones.
The indicator offers professional visualization with adjustable opacity, customizable color zones, optional volume percentage labels, and a customizable POC line. Smart auto-range technology calculates optimal price ranges based on the lookback period or manual input. Performance is optimized for smooth updates and analysis of up to 500 bars without lag.
Heatmap is suitable for identifying institutional accumulation and distribution zones, spotting support and resistance levels, understanding market structure, and conducting multi-timeframe volume profile analysis across markets including Forex, indices, and XAUUSD (gold).
Ulasan pelanggan
5 | 67 % | |
4 | 33 % | |
3 | 0 % | |
2 | 0 % | |
1 | 0 % |


