
SMC
Indikator
179 muat turun
Versi 1.0, Feb 2026
Windows, Mac
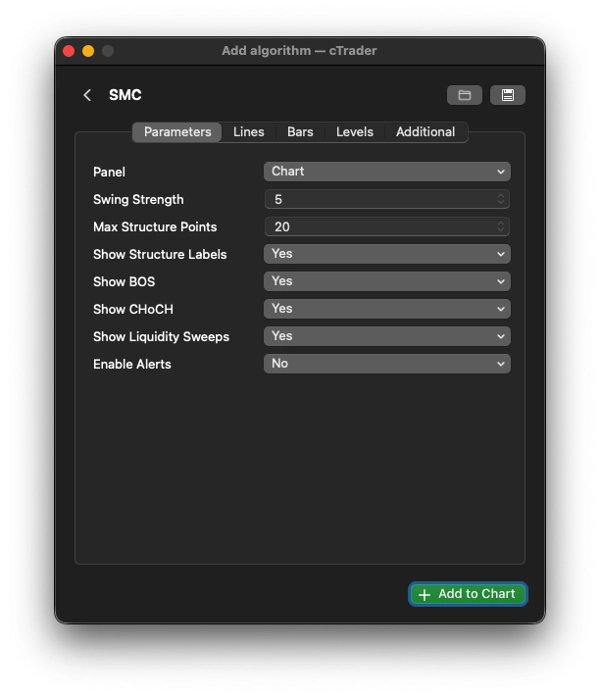
Ringkasan logik teras – bagaimana ia memutuskan apa itu apa
- Mengesan ayunan menggunakan logik fraktal klasik (Bar KekuatanAyunan kiri + kanan)
-
- Default = 5 → ayunan yang agak bersih pada kebanyakan jangka masa
- Menentukan tren daripada dua tinggi terakhir + dua rendah terakhir:
-
- TT + TR → Tren menaik
- RT + RR → Tren menurun
- Pengesanan BOS / CHoCH (pada penutupan):
-
- Penutupan > tinggi ayunan sebelumnya
-
- Jika tren menaik → BOS (sambungan)
- Jika tren menurun → CHoCH (potensi pembalikan)
- Penutupan < rendah ayunan sebelumnya → logik bertentangan
- Sapuan kecairan (corak SMC yang sangat biasa):
-
- Sumbu tinggi di atas tinggi ayunan terakhir tetapi penutupan di bawahnya → sapuan menaik (kemungkinan palsu ke atas)
- Sumbu rendah di bawah rendah ayunan terakhir tetapi penutupan di atasnya → sapuan menurun
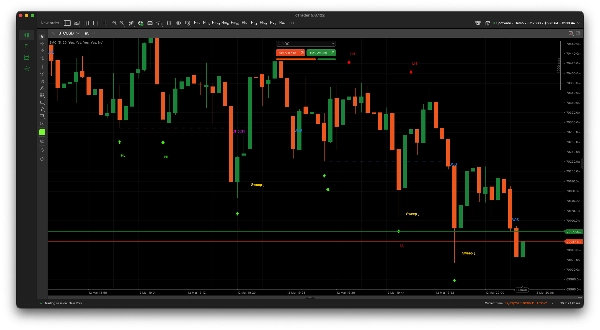
Penggunaan dagangan SMC tipikal bagi penunjuk sebegini
- Cari CHoCH + sapuan kecairan dalam arah bertentangan → persediaan pembalikan awal
- Berdagang mengikut arah BOS selepas penarikan balik / sapuan
- Elakkan berdagang bertentangan dengan struktur yang ditunjukkan oleh label TT/TR vs RT/RR
- Ramai pedagang menunggu sapuan → pengesahan CHoCH/BOS urutan pengesahan
Profil indikator
0.0
Ulasan: 0
Ulasan pelanggan
Belum ada ulasan untuk produk ini. Anda sudah mencuba produk tersebut? Jadilah yang pertama untuk berkongsi pendapat anda!
BTCUSD
Forex
Breakout
Indices
EURUSD
Commodities
GBPUSD
NZDUSD
RSI
Prop
ZigZag
Scalping
Fair Value Gap
SMC
Crypto
Stocks
XAUUSD
NAS100
USDJPY
Produk yang tersedia melalui cTrader Store, termasuk bot dagangan, indikator dan plugin, disediakan oleh pembangun pihak ketiga dan diberikan akses untuk tujuan maklumat dan teknikal sahaja. cTrader Store bukan broker dan tidak memberikan nasihat pelaburan, syor peribadi atau sebarang jaminan prestasi masa hadapan.
Lebih banyak produk daripada penulis ini


Sejak 01/12/2025
179
Pemasangan percuma