
Dominator M4tr1x
Ini adalah alat maklumat asas yang menggabungkan analisis struktur harga smart-money pada carta dengan beberapa panel papan pemuka maklumat. Berikut adalah pecahan setiap sistem utama:
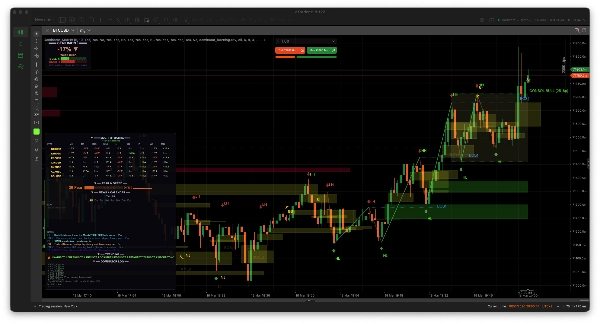
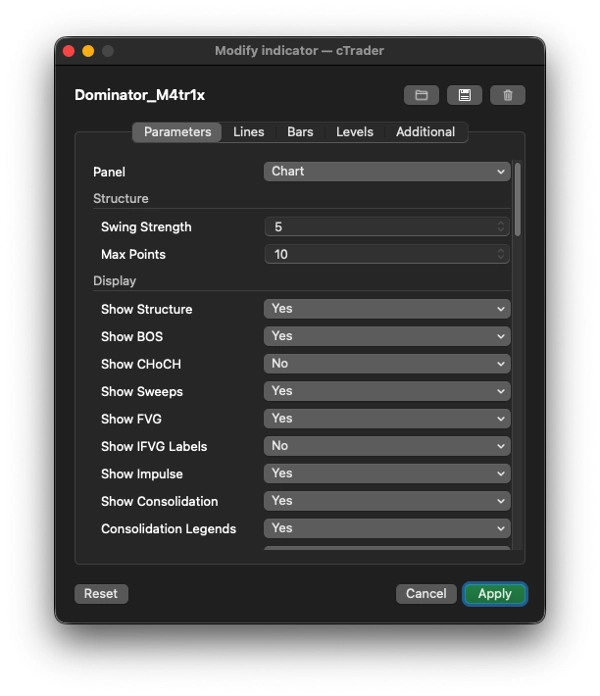
1. 📊 DI ATAS CARTA: Analisis Struktur Smart Money
Melukis terus pada carta harga:
Ciri
Apa yang dilakukannya ;
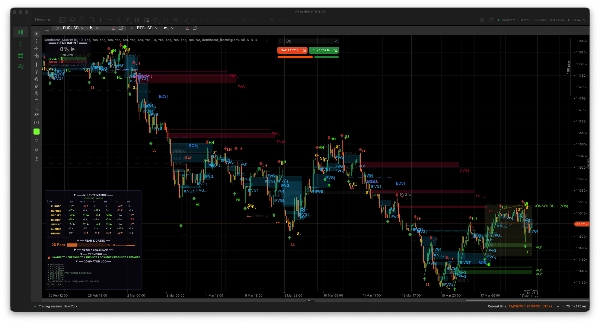
Pengesanan Ayunan
Mengenal pasti ayunan tinggi/rendah menggunakan kekuatan lookback yang boleh dikonfigurasikan, menandakan mereka dengan anak panah (▲/▼)
Label Struktur
Melabel setiap ayunan sebagai HH (Tinggi Lebih Tinggi), HL (Rendah Lebih Tinggi), LH (Tinggi Lebih Rendah), LL (Rendah Lebih Rendah) untuk memetakan struktur pasaran
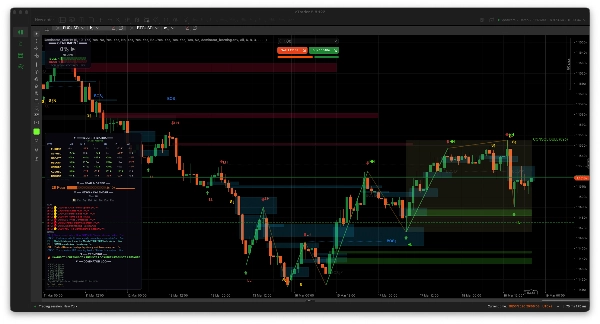
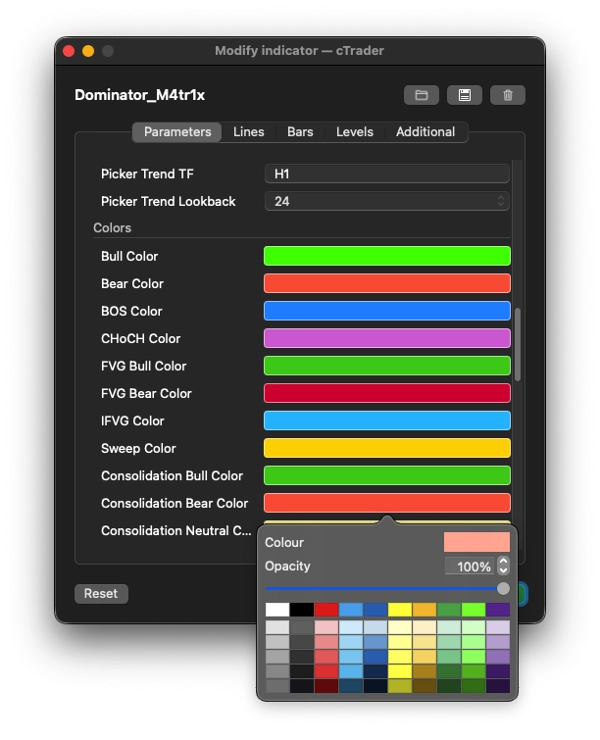
BOS (Pecah Struktur)
Melukis garis putus-putus + label apabila harga memecah ayunan tinggi/rendah sebelumnya dalam arah trend
CHoCH (Perubahan Watak)
Sama seperti BOS tetapi melawan trend — menandakan potensi pembalikan trend
Pengesahan Pecahan
Jika harga berbalik kembali melalui tahap BOS/CHoCH, ia menandakannya sebagai gagal (kelabu dengan ✗) dan merekodkannya
Penyapuan Likuiditi
Mengesan apabila harga melepasi ayunan tinggi (atau di bawah ayunan rendah) tetapi ditutup kembali di dalam — corak pengambilan likuiditi klasik
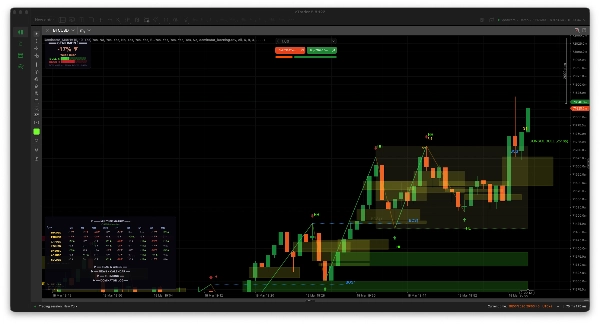
FVG (Jurang Nilai Adil)
Mengesan ketidakseimbangan 3 lilin (jurang antara tinggi lilin 1 dan rendah lilin 3). Melukis segi empat berwarna pada carta
IFVG (FVG Terbalik)
Apabila harga kembali untuk mengisi FVG, ia melabelkannya sebagai "IFVG" (jurang menjadi zon sokongan/rintangan berpotensi)
Pembatalan FVG
Jika harga ditutup dengan tegas melalui zon FVG, ia ditandakan sebagai batal
Gelombang Impuls
Menyambungkan titik ayunan dengan garis trend — hijau untuk kaki impuls (seiring trend), kuning untuk kaki pembetulan
Zon Konsolidasi
Mengesan apabila ayunan tinggi dan rendah berturut-turut berada dalam julat sempit berdasarkan ATR, melukis kotak dengan label "CONSOL BULL/BEAR/NEUTRAL" yang menunjukkan bias arah dan lebar pip
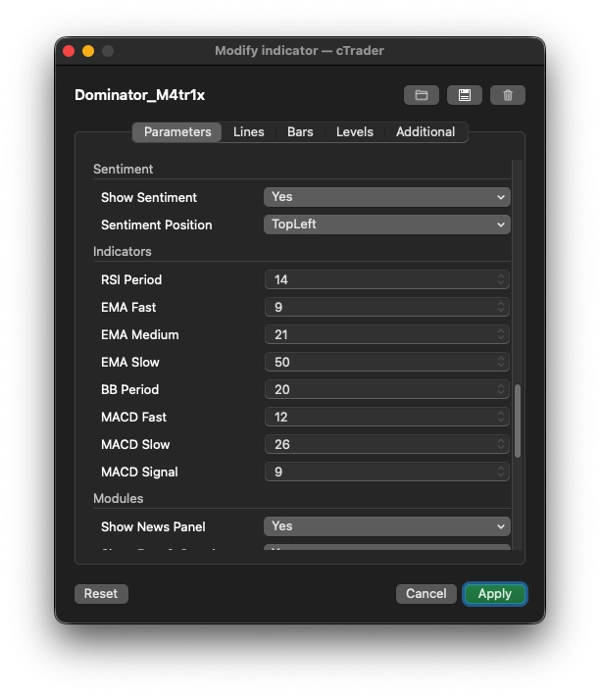
2. 📈 PANEL SENTIMEN (kiri atas secara lalai)
Satu penunjuk skor bull/bear masa nyata untuk simbol/jangka masa carta semasa menggunakan:
- RSI (terlebih jual/beli + pengesanan divergensi)
- MACD (persilangan, momentum histogram)
- 3 EMA (penyelarasan pantas/sederhana/lambat dan kedudukan harga relatif kepada mereka)
- Bollinger Bands (harga pada ekstrem jalur atas/bawah)
Memaparkan:
- Satu skor peratusan dari -100% hingga +100% (contoh, "+67% BULL KUAT")
- Bar mata visual bull vs. bear (█████░░░░)
- Statistik isyarat berjalan (jumlah isyarat, disahkan, dibatalkan, peratus ketepatan)
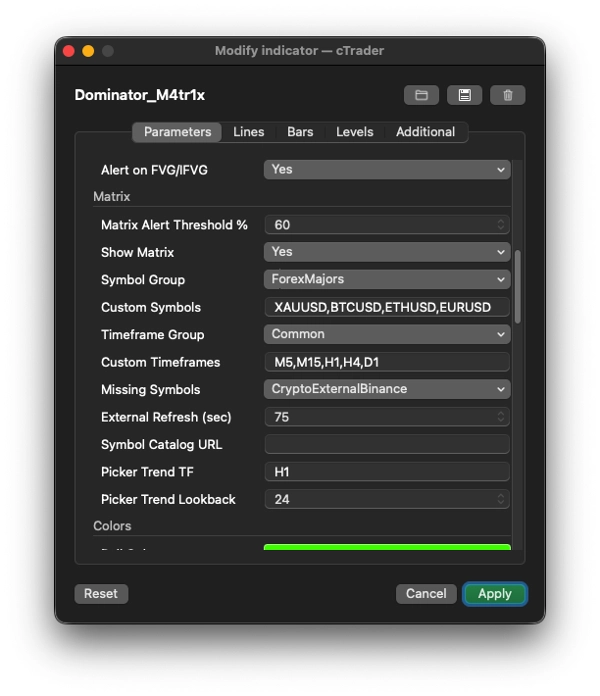
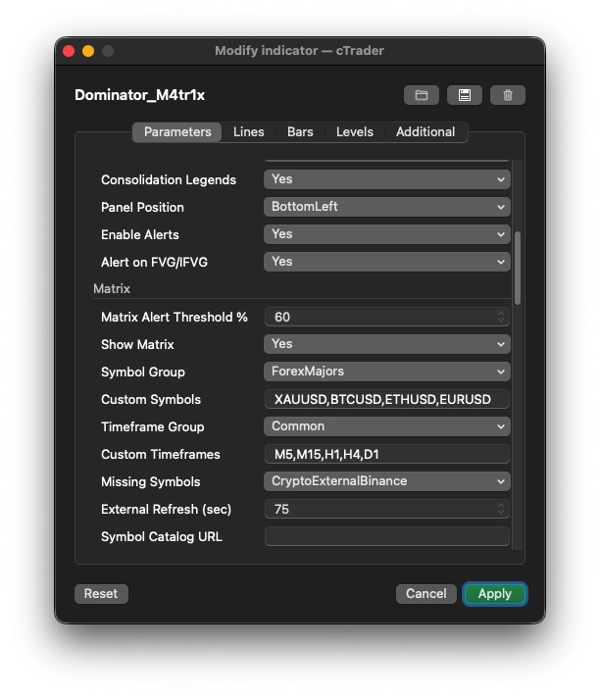
3. 🔢 MATRIKS PELBAGAI JANGKA MASA (panel utama)
Satu grid/peta haba yang menunjukkan skor sentimen bull/bear merentasi pelbagai simbol × pelbagai jangka masa serentak.
Aspek
Perincian
Kumpulan simbol
Forex Utama/Kecil/Exotics, Crypto, Indeks, Saham AS, Logam, Tenaga, Komoditi, atau Tersuai
Kumpulan jangka masa
Biasa (M5–W1), Semua, atau Tersuai
Setiap sel
Memaparkan skor berwarna seperti "+42▲" (hijau) atau "-67▼" (merah) menggunakan enjin skor RSI/MACD/EMA/BB yang sama
Resolusi simbol
Sangat kukuh — mengesan automatik konvensyen penamaan broker (akhiran seperti .r, m, .cash, garis miring seperti EUR/USD), mencuba berpuluh-puluh variasi alias, menyimpan hasil dalam cache
Data luaran
Untuk simbol yang tidak disediakan oleh broker (terutamanya crypto), mengambil data OHLC dari Binance, Bybit, OKX, Kraken, Bitfinex API (percuma, tanpa kunci diperlukan)
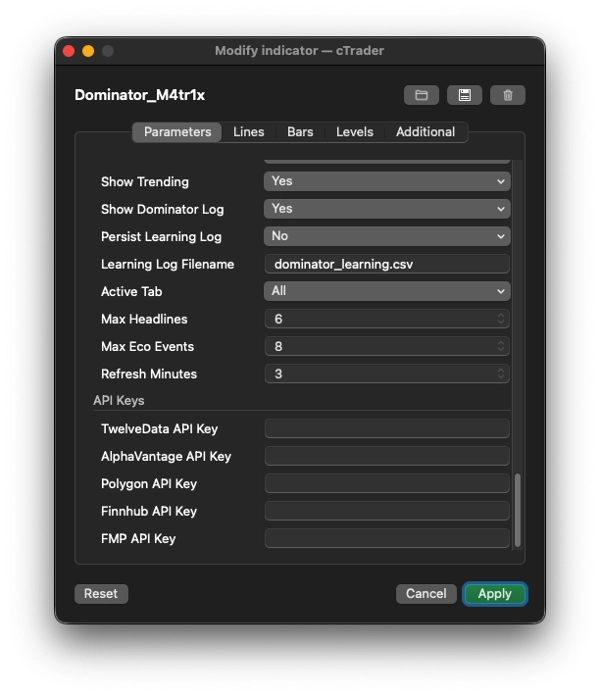
API Premium
Sokongan pilihan untuk TwelveData, AlphaVantage, Polygon, Stooq untuk saham/indeks/forex melalui kunci API
Interaktif
Klik mana-mana nama simbol → membuka pemilih simbol yang boleh dicari dengan lebih 100 simbol merentasi semua kategori, memaparkan perubahan % 24 jam. Klik mana-mana tajuk jangka masa → membuka pemilih jangka masa untuk menukar lajur
Amaran
Apabila mana-mana sel melebihi ambang yang boleh dikonfigurasikan (contoh, ±60%), memainkan bunyi amaran
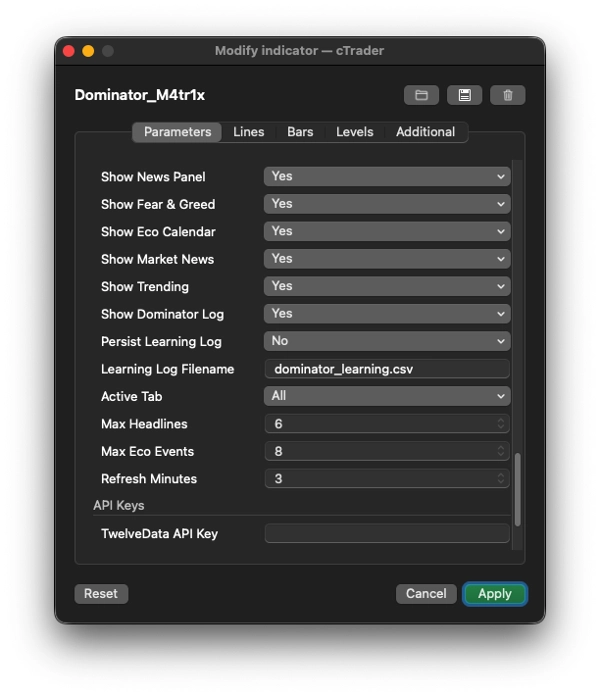
4. 📰 PANEL BERITA + MAKLUMAT
Kalendar Ekonomi
Mengumpul acara ekonomi berimpak tinggi/sederhana yang akan datang dari 8+ sumber berlebihan:
- ForexFactory (JSON + XML), TradingView, Finnhub, TradingEconomics, MQL5, FXStreet, FMP (FinancialModelingPrep)
- Berwarna mengikut keutamaan (merah = SEKARANG, oren = <15 min, kuning = <1 jam, hijau = kemudian)
Tajuk Berita Pasaran
Mengumpul dari 12+ sumber RSS/API:
- Crypto: CryptoCompare, CoinDesk, CoinTelegraph, NewsBTC, pengumuman Binance, status sistem OKX
- Forex: FXStreet, ForexLive
- Indeks/Saham: MarketWatch, CNBC, Reuters, Yahoo Finance
- Mengkategorikan tajuk secara automatik (crypto/forex/logam/tenaga/saham) melalui pengesanan kata kunci
- Boleh ditapis mengikut tab (Semua, Forex, Crypto, Logam, Indeks, Saham, Tenaga, Ekonomi)
Indeks Ketakutan & Ketamakan
- Mengambil Indeks Ketakutan & Ketamakan Crypto (API alternative.me, dengan fallback CNN Business)
- Memaparkan nilai nombor (0–100), label (Ketakutan Melampau → Ketamakan Melampau), bar warna, dan sejarah sparkline 7 hari (▁▂▃▄▅▆▇█)
Trending
- Mengambil penggerak crypto teratas dari penanda harga 24 jam Binance (5 pemenang teratas + 5 kalah teratas)
- Beralih ke CoinGecko trending atau CoinPaprika jika perlu
5. 📝 LOG DOMINATOR + SISTEM PEMBELAJARAN
- Menyimpan log isyarat yang menunjukkan 8 isyarat terakhir dengan status (● aktif, ✓ disahkan, ✗ dibatalkan)
- Mengikuti keseluruhan statistik ketepatan (jumlah isyarat, pengisian disahkan, pembatalan, peratus ketepatan)
- Ketekalan CSV pilihan: menulis setiap acara isyarat (baru/sahkan/batal) ke fail CSV (
dominator_learning.csv) dengan metadata penuh — direka untuk digunakan dalam pembelajaran mesin atau ujian semula masa depan
6. 🛠 Sorotan Seni Bina Teknikal
- Sepenuhnya bertindih (
IsOverlay = true) — melukis pada carta harga, bukan panel berasingan - AccessRights = None — berjalan dalam sandbox broker (tiada akses sistem fail / rangkaian selain apa yang dibenarkan cAlgo)
- Pengambilan data tak segerak — semua panggilan HTTP berjalan pada thread latar belakang melalui
Task.Run()supaya tidak menghalang carta - Caching pintar — resolusi simbol, data OHLC luaran, harga ticker, dan peratusan trend semua disimpan dalam cache dengan selang penyegaran yang boleh dikonfigurasikan
- Cuba semula automatik — resolusi simbol yang gagal dan pengambilan data luaran cuba semula setiap 45 saat
- Bahagian boleh lipat — setiap bahagian panel (Matrix, Ketakutan & Ketamakan, Berita, Trending, Log) boleh dilipat/buka dengan mengklik tajuknya
Kesimpulannya
Dominator M4tr1x adalah penunjuk Informatif yang menggantikan keseluruhan papan pemuka perdagangan. Ia memetakan struktur smart-money pada carta (BOS, CHoCH, FVG, sapuan, konsolidasi), memberi skor sentimen multi-asset/multi-jangka masa melalui penunjuk teknikal, mengumpul kalendar ekonomi dan berita pasaran dari 20+ sumber, mengesan Ketakutan & Ketamakan, memaparkan aset trending, merekod semua isyaratnya dengan penjejakan ketepatan, dan membolehkan anda menukar simbol dan jangka masa secara interaktif — semuanya sambil mengambil data yang hilang dari 5+ API pertukaran luaran di latar belakang.
5 | 0 % | |
4 | 100 % | |
3 | 0 % | |
2 | 0 % | |
1 | 0 % |

![Logo "[Stellar Strategies] Inside Bar with Signals"](https://cdn.ctrader.com/image/webp/1d9e8bfa-3b2c-4440-bb37-5856902008a7_30683)


