
Trend Cycle
Wskaźnik
181 pobrania
Wersja 1.0, Nov 2025
Windows, Mac
Opis
Trend Cycle to narzędzie do analizy trendów, które koncentruje się na czasie trwania trendu, a nie tylko na kierunku.
To:
- Wykrywa trend wzrostowy i trend spadkowy na podstawie nachylenia Hull Moving Average (HMA).
- Liczy, ile świec bieżący trend jest aktywny (Rzeczywista długość).
- Przechowuje długości ostatnich trendów wzrostowych i trendów spadkowych osobno.
- Oblicza średnią długość trendów wzrostowych i spadkowych (Śr. wzrost / Śr. spadek).
- Rysuje:
-
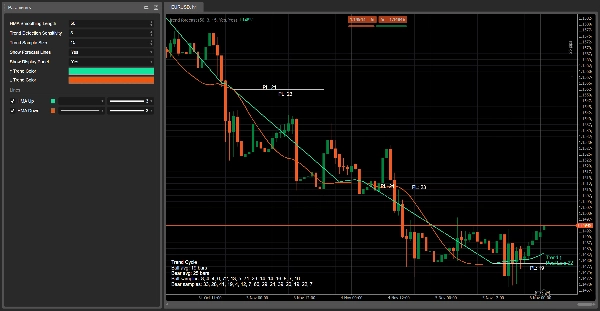
- Zieloną HMA podczas trendów wzrostowych i czerwoną HMA podczas trendów spadkowych.
- Poziome linie projekcji na początku każdego trendu, z etykietą taką jak
PL: 18(Prawdopodobna długość w świecach). - Etykietę na żywo blisko bieżącej ceny pokazującą kierunek trendu i Rzeczywistą długość.
- Panel wyświetlania z:
-
- średnią długość trendów wzrostowych i spadkowych,
- listy ostatnich długości trendów (do wybranego rozmiaru próbki).
Celem jest pomoc w odpowiedzi na pytanie:
„Jak stary jest ten trend i jak długo zwykle trwają takie trendy?”
Jak to działa (logika)
- Hull Moving Average (HMA)
Wskaźnik oblicza Hull Moving Average z ceny zamknięcia, używając parametru Długość wygładzania HMA.
HMA jest gładsza niż prosta/EMA, ale szybko reaguje na zmiany kierunku. - Wykrywanie trendu na podstawie nachylenia
Przez ostatnie Czułość wykrywania trendu świec, sprawdza HMA:
Dopóki trend jest zdefiniowany, licznik (Rzeczywista dł.) jest zwiększany co świecę, reprezentując czas trwania bieżącego trendu. -
- Jeśli HMA była ściśle rosnąca → trend jest wzrostowy (↑).
- Jeśli HMA była ściśle malejąca → trend jest spadkowy (↓).
- W przeciwnym razie zachowuje poprzedni stan trendu.
- Rejestrowanie długości trendów
Gdy trend zmienia się z wzrostowego na spadkowy lub odwrotnie: -
- Przechowywana jest długość zakończonego trendu:
-
- trendy wzrostowe do listy trendów wzrostowych,
- trendy spadkowe do listy trendów spadkowych.
- Każda lista jest ograniczona przez Rozmiar próbki trendów (np. ostatnie 10 trendów).
- Te próbki są używane do obliczenia:
-
- Śr. wzrost = średnia długość trendu wzrostowego.
- Śr. spadek = średnia długość trendu spadkowego.
- Projekcje prawdopodobnej długości
Na początku każdego nowego trendu, jeśli jest wystarczająco dużo próbek:
Te projekcje są zachowywane na wykresie jako historia, aby można było wizualnie porównać przewidywane i rzeczywiste długości trendów. -
- Oblicza średnią długość dla tego typu trendu (wzrostowego lub spadkowego).
- Rysuje poziomą linię od świecy początkowej trendu na około tyle świec.
- Umieszcza etykietę na środku linii:
-
PL: X→ Prawdopodobna długość = X świec.
- Etykieta na żywo
Na każdej świecy wskaźnik rysuje pojedynczą etykietę na żywo blisko HMA:
Pokazuje to bieżący kierunek trendu i dokładnie ile świec trwał do tej pory. -
- Przykładowy tekst:
-
Trend ↑
Rzeczywista dł.: 7
- Kolor:
-
- Zielony (↑) dla trendów wzrostowych
- Pomarańczowy/czerwony (↓) dla trendów spadkowych
- Panel wyświetlania (lewy dolny róg)
Gdy włączona jest opcja Pokaż panel wyświetlania, w rogu wykresu pojawia się statyczny panel tekstowy pokazujący:
Działa to jako szybki przegląd statystyczny ostatnich zachowań trendów na danym symbolu/interwale. -
- Tytuł: Trend Cycle
Śr. wzrost: X świecŚr. spadek: Y świecPróbki wzrostowe:lista ostatnich długości trendów wzrostowychPróbki spadkowe:lista ostatnich długości trendów spadkowych
Jak czytać to w praktyce
- Zielona HMA + „Trend ↑”
→ Aktywny jest trend wzrostowy.
→Rzeczywista dł.mówi, ile świec trwał do tej pory.
→ Najnowsza liniaPL: Xdaje wizualne wyobrażenie, jak długo zwykle trwają podobne trendy wzrostowe. - Czerwona HMA + „Trend ↓”
→ Aktywny jest trend spadkowy.
→Rzeczywista dł.= wiek bieżącego trendu spadkowego.
→ Porównaj Rzeczywistą dł. zŚr. spadekw panelu, aby zobaczyć, czy ruch jest młody czy dojrzały. - Gdy Rzeczywista dł. zbliża się do lub przekracza średnią (Śr. wzrost / Śr. spadek):
→ Bieżący trend jest statystycznie „stary” w porównaniu z ostatnią historią.
→ Możesz zdecydować się na: -
- zaostrzenie stopów,
- zabezpieczenie zysków,
- bycie bardziej ostrożnym przy nowych wejściach w tym kierunku.
- Krótkie trendy vs długie trendy
-
- Wiele bardzo krótkich trendów → środowisko niestabilne / powracające do średniej.
- Niewiele długich trendów → rynek bardziej kierunkowy, z przedłużonymi ruchami.
Podsumowanie
Podsumowanie AI
Trend Cycle is a technical indicator designed to analyze trend duration in financial markets. It detects bullish and bearish trends by evaluating the slope of a Hull Moving Average (HMA) applied to closing prices, providing a smoother yet responsive measure of trend direction. The indicator counts the number of bars the current trend has been active (Real Length) and records the lengths of recent up-trends and down-trends separately. Using these samples, it calculates average durations for bullish and bearish trends.
Visual elements include a green HMA line during bullish trends and a red HMA line during bearish trends. Horizontal projection lines mark the probable length of each trend at its start, labeled with "PL: X" to indicate expected duration in bars. A live label near the current price displays the active trend direction and its age in bars. An optional display panel offers a summary of average trend durations and recent trend length samples.
Trend Cycle helps users assess how long the current trend has lasted relative to historical trends, aiding decisions such as adjusting stops or managing entries. It supports analysis across various markets including Forex, cryptocurrencies, indices, commodities, and stocks.
Profil wskaźnika
Opinie klientów
0.0
Opinie: 0
Opinie klientów
Ten produkt nie ma jeszcze opinii. Wypróbowałeś(-aś) go już? Bądź pierwszy(-a) i powiedz o tym innym!
Dyskusja
Częste pytania
BTCUSD
Forex
Signal
Breakout
Indices
EURUSD
Commodities
GBPUSD
NZDUSD
Martingale
Bollinger
Prop
ZigZag
Scalping
Supertrend
Crypto
Grid
Stocks
AI
XAUUSD
NAS100
USDJPY
Produkty dostępne za pośrednictwem cTrader Store, w tym boty handlowe, wskaźniki i wtyczki, dostarczane są przez deweloperów zewnętrznych i udostępniane wyłącznie w celach informacyjnych oraz w celu zapewnienia dostępu technicznego. cTrader Store nie jest brokerem i nie zapewnia doradztwa inwestycyjnego, nie udziela spersonalizowanych rekomendacji ani nie gwarantuje przyszłych wyników.


Cena
42.11M
Wolumen transakcji
6.13M
Zysk w pipsach
230
Sprzedaż
8.52K
Bezpłatne instalacje