
Penerangan
Bar Force ialah penunjuk analisis kekuatan bar yang direka untuk membantu pedagang mengenal pasti dengan cepat saat pengembangan volatiliti dan momentum pasaran.
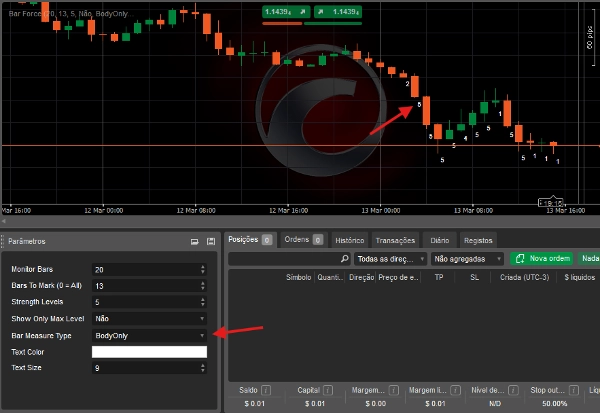
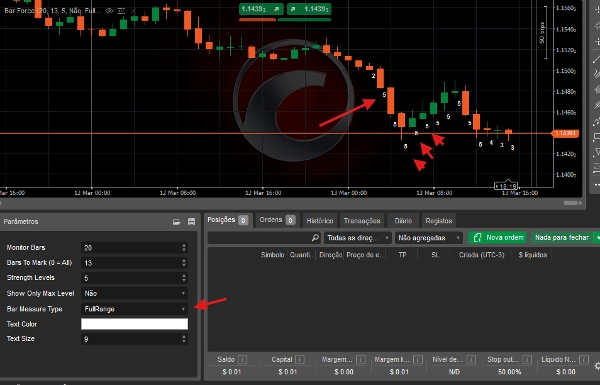
Penunjuk ini secara automatik mengklasifikasikan setiap bar berdasarkan kekuatannya relatif berbanding bar sebelumnya, memaparkan nilai berangka terus pada carta. Ini memudahkan untuk mengenal pasti lilin yang lemah, sederhana, atau sangat kuat dalam konteks pasaran terkini.
Versi Penuh menyediakan kawalan lengkap ke atas parameter analisis, membolehkan pedagang menyesuaikan penunjuk untuk pasaran, jangka masa, dan gaya perdagangan yang berbeza.
Ciri-ciri Utama
✔ Pengelasan kekuatan bar automatik
✔ Berdasarkan volatiliti pasaran terkini
✔ Paparan terus pada carta untuk analisis visual cepat
✔ Sesuai untuk Perdagangan Price Action, Breakout, dan Momentum
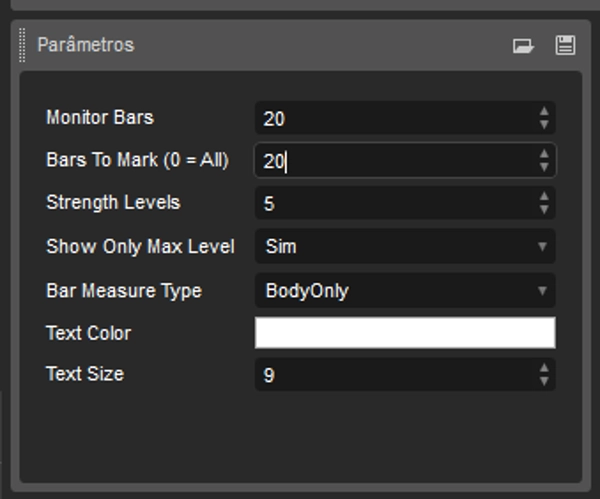
Parameter Boleh Disesuaikan
Versi penuh menawarkan penyesuaian lengkap.
Jenis pengukuran bar
Pengguna boleh memilih bagaimana kekuatan setiap bar dikira:
- Julat Penuh – menggunakan julat keseluruhan lilin (Tinggi – Rendah)
- Hanya Badan – menggunakan hanya badan lilin (Buka – Tutup)
Ini membolehkan penunjuk digunakan untuk kedua-dua analisis volatiliti dan analisis kekuatan arah.
Julat pemantauan
Menentukan berapa banyak bar sebelumnya digunakan untuk mengira kekuatan purata pasaran.
Contoh:
- 50 bar
- 100 bar
- 200 bar
Ini membolehkan penunjuk menyesuaikan diri dengan keadaan pasaran yang berbeza.
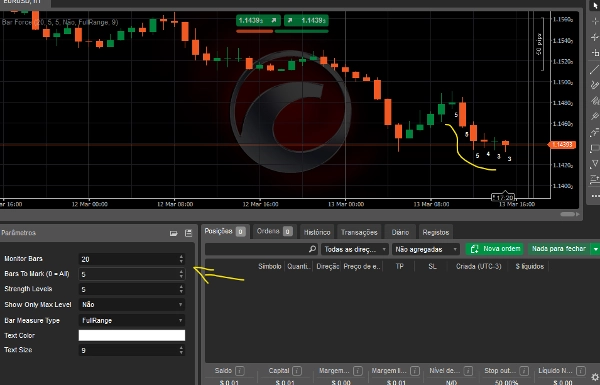
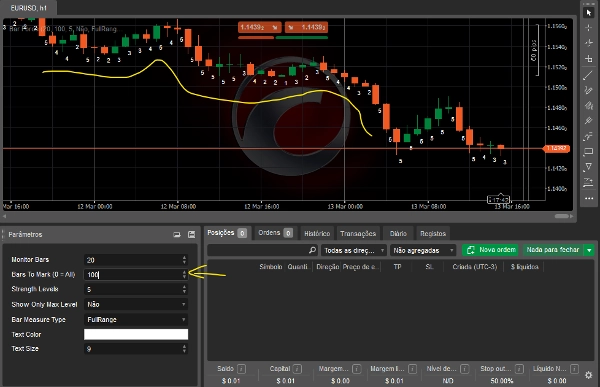
Bilangan bar yang dipaparkan
Pedagang boleh memilih berapa banyak bar terkini yang akan memaparkan pengelasan kekuatan pada carta.
Contoh:
- 5 bar terakhir
- 20 bar terakhir
- atau keseluruhan sejarah
Skala kekuatan
Menentukan berapa banyak tahap pengelasan yang digunakan.
Contoh:
- skala dari 1 hingga 3
- skala dari 1 hingga 5
- atau julat tersuai
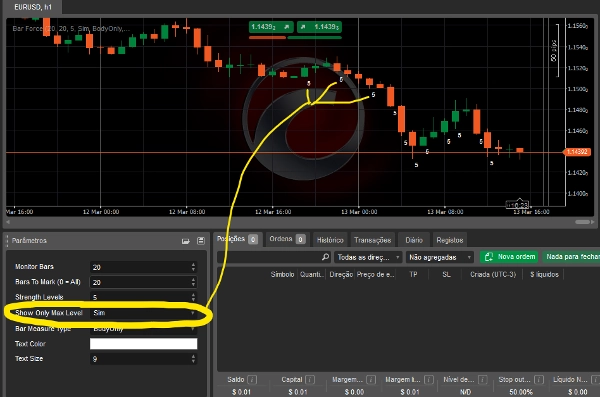
Penapis tahap maksimum
Pilihan untuk memaparkan hanya bar yang mencapai tahap kekuatan maksimum, memudahkan untuk mengenal pasti peristiwa momentum kuat.
Penyesuaian visual
Pengguna juga boleh menyesuaikan:
- warna teks
- saiz teks
membolehkan penunjuk disesuaikan dengan susun atur carta mereka.
Siapakah penunjuk ini untuk?
- Pedagang Price Action
- Pedagang Breakout
- Pedagang yang ingin mengenal pasti momentum dan pengembangan volatiliti
Bar Force mengubah analisis lilin visual menjadi pengelasan kekuatan objektif, membantu pedagang mengenal pasti peluang berpotensi dalam pasaran dengan cepat.
Ringkasan
Ulasan pelanggan
5 | 67 % | |
4 | 33 % | |
3 | 0 % | |
2 | 0 % | |
1 | 0 % |