
Penerangan
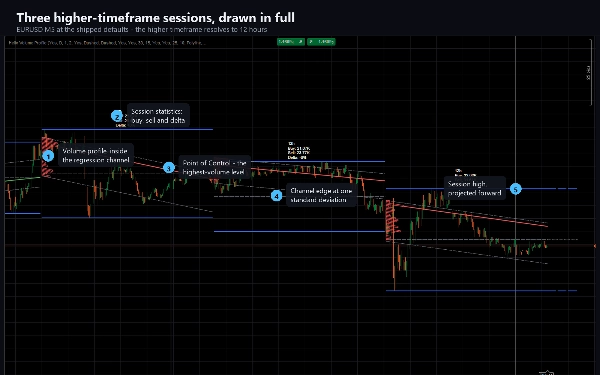
Profil Isipadu Helix membina gambaran lengkap sesi jangka masa lebih tinggi yang carta semasa berada di dalamnya.
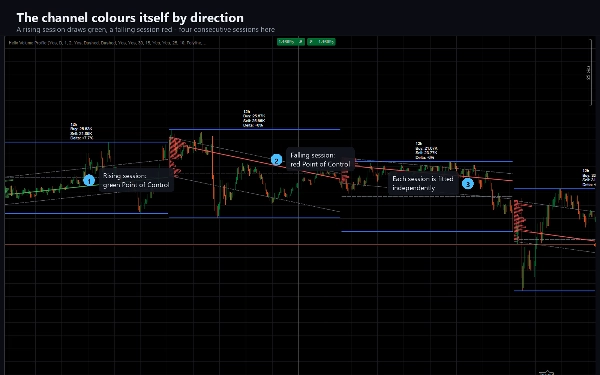
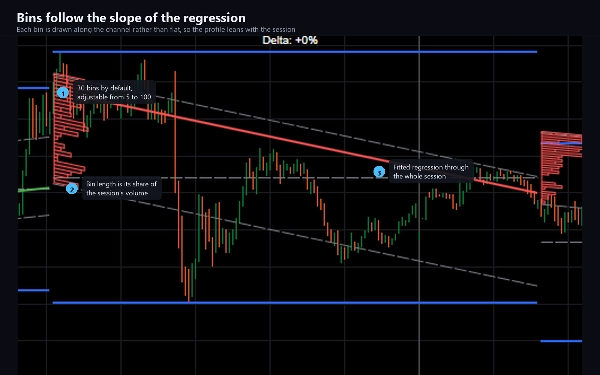
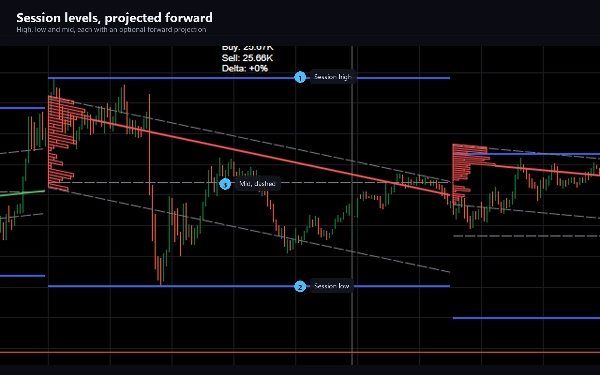
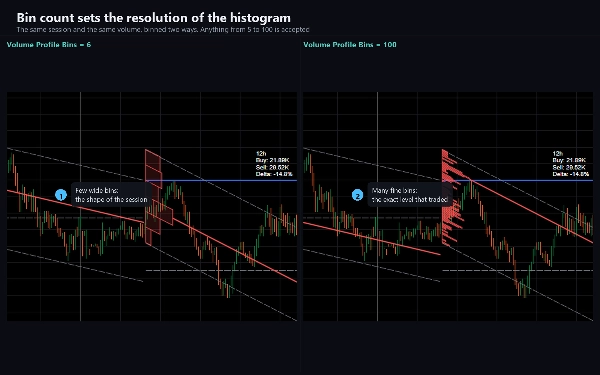
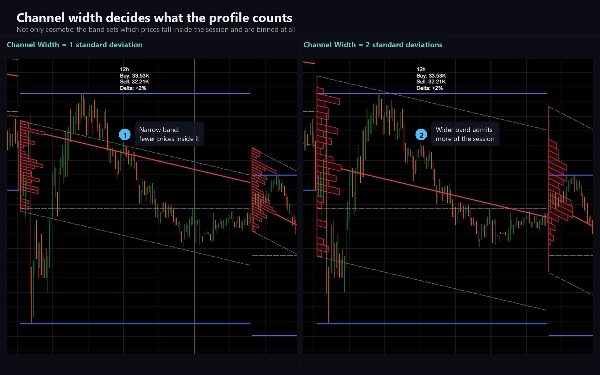
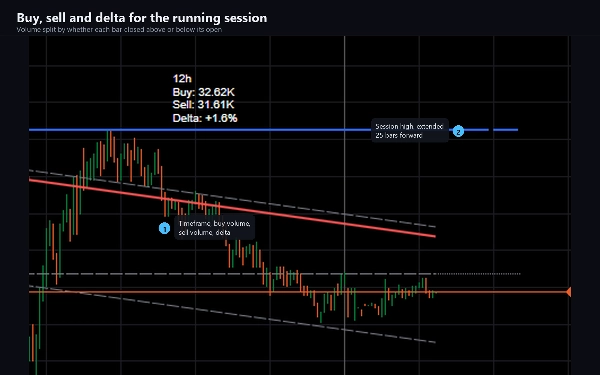
Untuk setiap sesi, ia memasang regresi logaritma merentasi setiap bar setakat ini, melukis saluran dengan bilangan sisihan piawai yang boleh dikonfigurasikan di sekelilingnya, dan mengisi saluran itu dengan profil isipadu yang bin-bin nya mengikuti cerun regresi dan bukannya duduk rata. Bin isipadu tertinggi ditandakan dengan garis Titik Kawalan, berwarna mengikut arah saluran bergerak. Tahap tinggi, rendah dan tengah sesi dilukis di sebelah dan boleh diramalkan ke hadapan, dan label padat melaporkan isipadu beli, isipadu jual dan delta antara keduanya.
Jangka masa lebih tinggi dipilih untuk anda secara lalai dan menyesuaikan diri dengan carta: sesi 12 jam pada M5, empat jam pada M1, dua hari pada M15, seminggu pada H1, sebulan pada H4. Anda boleh mematikannya dan menetapkan sesi sendiri - minit, hari, minggu atau bulan semuanya diterima.
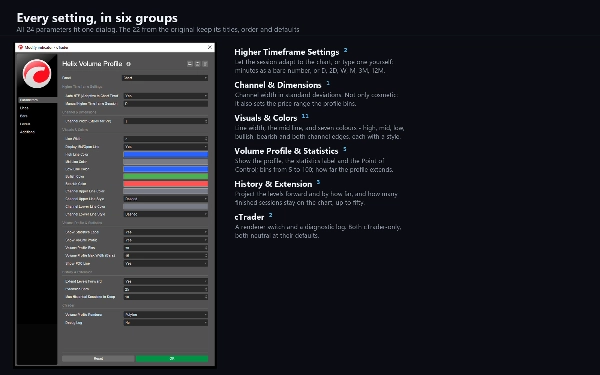
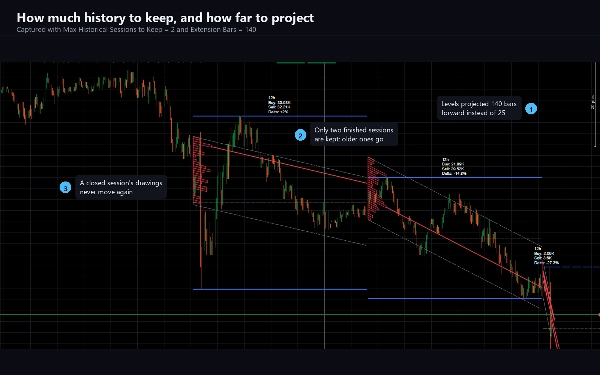
Segalanya boleh disesuaikan. Lebar saluran, bilangan bin profil dari 5 hingga 100, sejauh mana profil meluas, sama ada Titik Kawalan, label statistik dan ramalan ke hadapan dipaparkan, lebar dan gaya garis, tujuh warna, dan berapa banyak sesi selesai kekal pada carta, sehingga lima puluh.
APA GUNA NYA
Membaca di mana harga berada dalam struktur jangka masa lebih tingginya tanpa meninggalkan jangka masa kerja anda. Saluran menunjukkan pergerakan dan penyebaran sesi; profil menunjukkan di mana isipadu sebenarnya terkumpul di dalamnya; Titik Kawalan menandakan tahap yang melihat aktiviti paling banyak. Pedagang menggunakan ini untuk membingkai sokongan dan rintangan, menilai sama ada pergerakan terlalu jauh berbanding sesi, dan melihat sama ada pembelian atau penjualan menguasai.
Sesuai untuk mana-mana instrumen dan mana-mana jangka masa. Ia paling bermaklumat pada carta intrahari dari M1 hingga H4, di mana sesi adaptif memberikan tetingkap yang bermakna; pada Harian dan lebih tinggi, tetapkan sesi secara manual.
BAGAIMANA IA BERFUNGSI
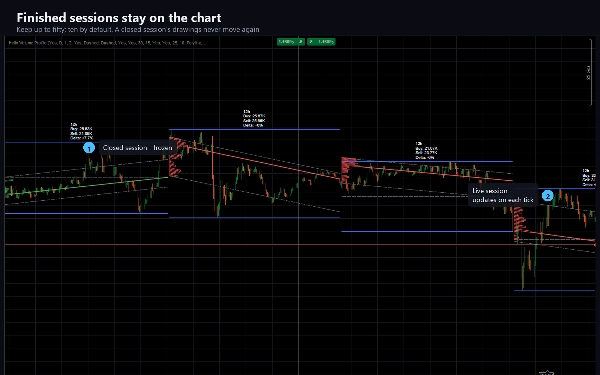
Sesi langsung dikemas kini pada setiap tik dan lukisan bergerak sehingga sesi ditutup - saluran dipasang semula, profil dibina semula dan tahap diukur semula apabila setiap bar tiba. Setelah sesi berakhir, lukisan dibekukan dan tidak berubah lagi. Ini disengajakan dan itulah cara kaedah ini berfungsi; jika anda memerlukan tahap yang tidak pernah bergerak intrabar, baca sesi yang ditutup dan bukannya sesi langsung.
Isipadu pada simbol forex adalah kiraan tik yang dilaporkan oleh broker anda, jadi profil mencerminkan suapan anda sendiri.
TEKNIKAL
Penunjuk, lapisan. 24 parameter. Tiada kebenaran perdagangan, tiada akses fail dan tiada akses rangkaian - ia dibina dengan AccessRights ditetapkan kepada Tiada dan tidak boleh membuat pesanan. Termasuk edisi percubaan terhad kepada EURUSD tanpa had masa dan tanpa ciri yang dilumpuhkan.
Dokumentasi merangkumi pemasangan, setiap parameter dengan tujuannya, dan panduan penyelesaian masalah yang menerangkan setiap tingkah laku yang mengejutkan orang.
Perdagangan melibatkan risiko. Prestasi lalu tidak menjamin keputusan masa depan.
Ringkasan
The higher timeframe session adapts automatically based on the chart timeframe (e.g., 12 hours on M5, one week on H1) but can be manually set to minutes, days, weeks, or months. Users can customize channel width, number of volume bins (5 to 100), profile extension, visibility of elements, colors, line styles, and how many past sessions remain visible (up to 50).
The live session updates on every tick, recalculating the channel and volume profile until session close, after which the data is fixed. Volume data reflects the broker's tick count for forex symbols. Helix Volume Profile is suitable for any instrument and timeframe, with particular utility on intraday charts from M1 to H4. It includes 24 adjustable parameters and operates without trading permissions or network access.
Perbincangan
Ulasan pelanggan
5 | 0 % | |
4 | 100 % | |
3 | 0 % | |
2 | 0 % | |
1 | 0 % |