
Mô tả
Reverse RSI Phantom đảo ngược RSI. Thay vì vẽ bộ dao động trong một khung bên dưới
biểu đồ, nó giải công thức RSI ngược lại và đặt ra một câu hỏi khác: giá nào sẽ đặt
RSI chính xác ở mức 70, và giá nào sẽ đặt nó ở mức 30? Hai mức giá đó được vẽ trên biểu đồ dưới dạng
các dải, và chúng di chuyển theo từng cây nến.
Thay đổi đó đặt toàn bộ bộ dao động lên thang giá, nơi bạn có thể nhìn thấy nó so với
nến, so với các mức của bạn, và so với kế hoạch mà chỉ báo vẽ cho bạn.
NHỮNG GÌ NÓ VẼ
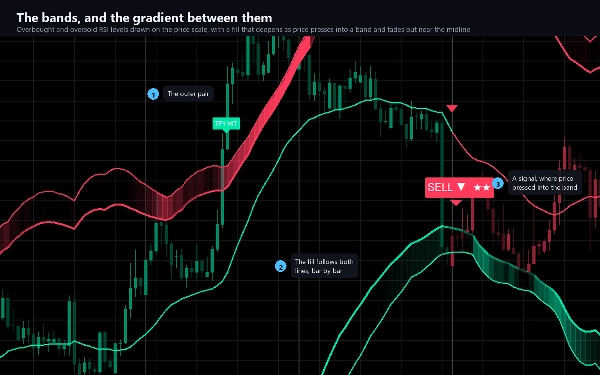
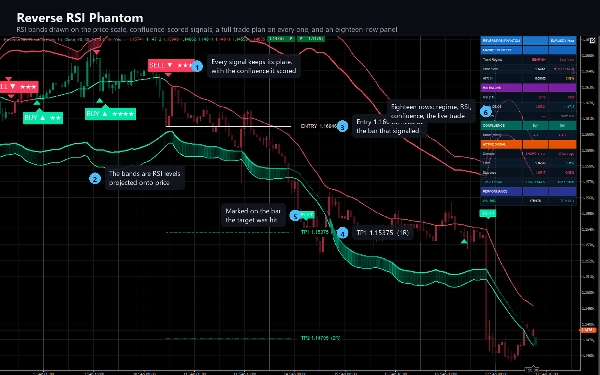
- Hai dải và các cạnh ngoài của chúng, tại các mức quá mua và quá bán mà bạn chọn, được chiếu lên
giá và tùy chọn làm mượt.
- Một lớp đổ màu gradient bên trong mỗi dải, đậm lên khi giá đẩy vào nó và mờ dần hoàn toàn
gần đường giữa, để biểu đồ cho bạn biết áp lực ở đâu mà không cần một con số nào.
- Một đường giữa mang màu sắc của chế độ xu hướng.
- Nến được nhuộm màu theo cùng chế độ đó, để hướng đi có thể đọc được ngay lập tức.
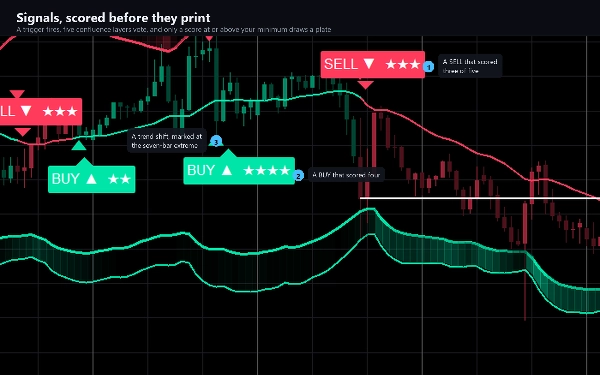
- Một bảng trên mỗi cây nến tín hiệu - MUA hoặc BÁN - với điểm hội tụ mà nó đạt được, trên tổng số năm điểm.
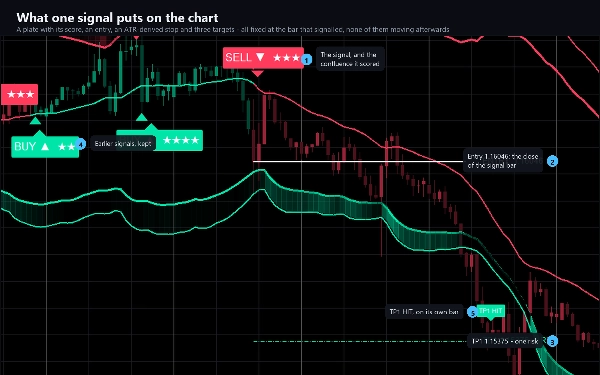
- Một kế hoạch giao dịch hoàn chỉnh trên cây nến tín hiệu: điểm vào, điểm dừng dựa trên ATR, và ba mục tiêu với tỷ lệ rủi ro
mà bạn đặt. Năm đường và năm nhãn giá, tất cả cố định tại cây nến đã báo hiệu.
- Một bảng trên cây nến đạt mỗi mục tiêu, và trên cây nến chạm điểm dừng.
- Các tam giác nơi chế độ xu hướng thay đổi, và các dấu nơi RSI phân kỳ so với giá.
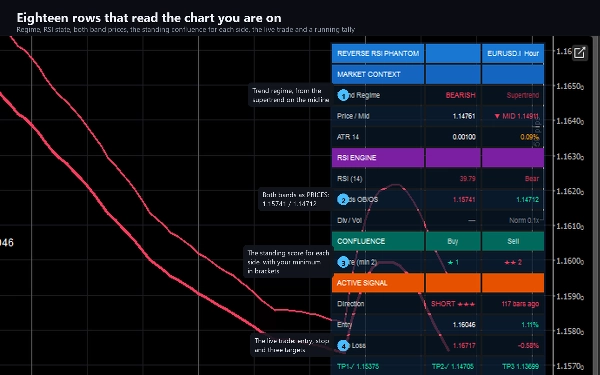
- Một bảng gồm mười tám hàng: chế độ, giá so với đường giữa, ATR, RSI và trạng thái của nó, cả hai dải dưới dạng
giá, phân kỳ, khối lượng, điểm hội tụ hiện tại cho mỗi bên, giao dịch trực tiếp với điểm vào,
điểm dừng và ba mục tiêu, và tổng kết những gì lịch sử biểu đồ đã làm.
CÁCH NÓ QUYẾT ĐỊNH
Một tín hiệu không phải là một điều kiện duy nhất. Một kích hoạt xảy ra - chế độ thay đổi, giá cắt qua một dải, hoặc một
phân kỳ được xác nhận - và sau đó năm lớp hội tụ bỏ phiếu: chế độ, xác nhận RSI, kiểm tra lại dải, phân kỳ, và kiểm tra khối lượng. Điểm số từ 0 đến 5, được hiển thị dưới dạng sao trên bảng, và
phải đạt mức tối thiểu bạn đặt trước khi bất cứ điều gì được vẽ. Một cổng xu hướng và bộ lọc làm mát theo hướng
lọc những gì còn lại, và nếu cả hai bên đủ điều kiện trên cùng một cây nến thì điểm cao hơn sẽ được chọn.
Chế độ Không Tô Lại được bật mặc định: một cây nến chỉ được đánh giá khi nó đã đóng, vì vậy bảng in ra
không bao giờ di chuyển và không bao giờ biến mất.
CÀI ĐẶT CHÍNH
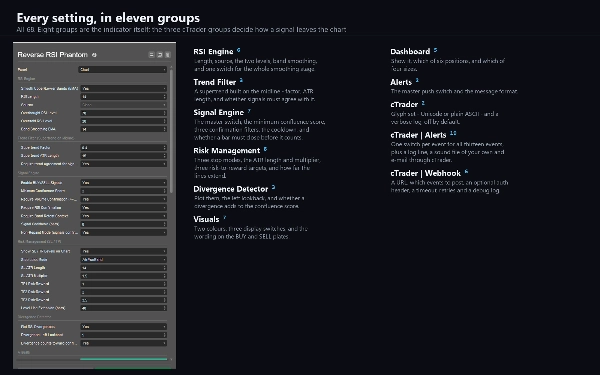
68 trong mười một nhóm. Độ dài RSI, nguồn và hai mức; làm mượt dải; hệ số bộ lọc supertrend và độ dài ATR; điểm hội tụ tối thiểu và ba bộ lọc xác nhận; thời gian làm mát tín hiệu; ba chế độ dừng với độ dài ATR và hệ số nhân; ba mục tiêu tỷ lệ rủi ro-lợi nhuận; khoảng nhìn lại phân kỳ; hai màu và chữ trên bảng; vị trí và kích thước bảng; và ba nhóm chỉ dành cho cTrader cho cảnh báo và webhook.
CẢNH BÁO VÀ WEBHOOK
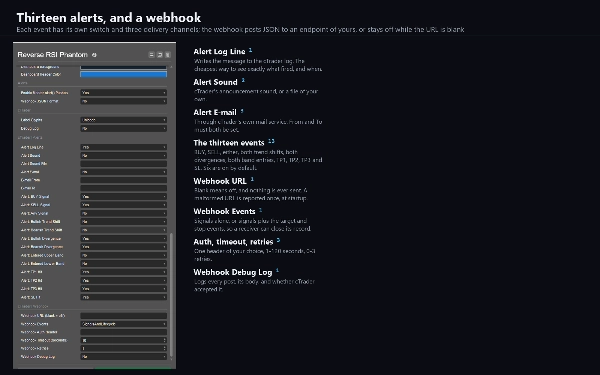
Mười ba sự kiện, mỗi sự kiện có công tắc riêng: MUA, BÁN, một trong hai, cả hai chuyển đổi xu hướng, cả hai phân kỳ, cả hai vào dải, cả ba mục tiêu và điểm dừng. Được gửi dưới dạng dòng nhật ký cTrader, âm thanh bạn chọn, và email. Không có gì kích hoạt khi chỉ báo duyệt lịch sử biểu đồ, và không có gì kích hoạt trong
kiểm tra lại.
Một webhook gửi các sự kiện tương tự dưới dạng JSON đến bất kỳ địa chỉ nào bạn chọn - một bot giao dịch, nhật ký, bộ chuyển tiếp, luồng tự động hóa. Nó sẽ tắt cho đến khi bạn nhập một địa chỉ, được loại bỏ trùng lặp theo sự kiện trên mỗi cây nến, giới hạn ở hai mươi tin nhắn mỗi phút, và lỗi được ghi lại thay vì ném ra. Nó gửi qua dịch vụ mạng riêng của cTrader, đó là lý do tại sao chỉ báo không cần quyền truy cập tệp hoặc mạng.
LOẠI VÀ CỬA SỔ
Một chỉ báo phủ: mọi thứ được vẽ trên biểu đồ giá, và nó không thêm khung riêng biệt nào.
KHUNG THỜI GIAN VÀ CÔNG CỤ
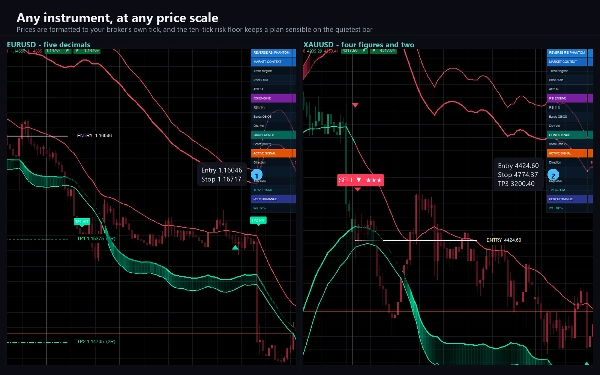
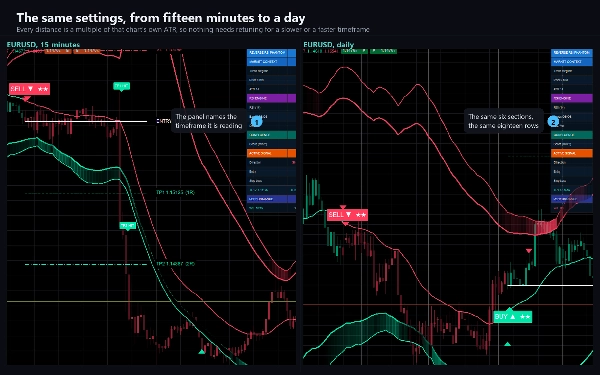
Bất kỳ. Mọi khoảng cách nó vẽ là bội số của ATR riêng của biểu đồ đó, và giá được định dạng theo tick riêng của nhà môi giới bạn, vì vậy không cần điều chỉnh lại giữa biểu đồ 15 phút và biểu đồ hàng ngày, hoặc giữa cặp FX có năm chữ số thập phân và vàng có bốn chữ số. Phạm vi từ M15 đến H4 là phạm vi mà phần lớn các thử nghiệm được thực hiện.
Cần có khối lượng: một trong năm lớp hội tụ đọc nó.
TRƯỜNG HỢP SỬ DỤNG
- Đọc áp lực quá mua và quá bán nơi nó thuộc về, trên thang giá.
- Thực hiện các điểm vào đảo chiều trung bình tại một dải với chế độ xu hướng làm bộ lọc.
- Biến tín hiệu thành kế hoạch: một điểm dừng và ba mục tiêu, được vẽ trước khi bạn hành động.
- Theo dõi một biểu đồ và được thông báo, qua dòng nhật ký, âm thanh, email hoặc webhook, khi có điều gì đó xảy ra.
DÀNH CHO AI
Các nhà giao dịch đã sử dụng RSI và muốn nó ở nơi mắt họ đang nhìn, và bất kỳ ai muốn tín hiệu đi kèm với điểm dừng và bộ mục tiêu thay vì một mũi tên.
DÙNG THỬ
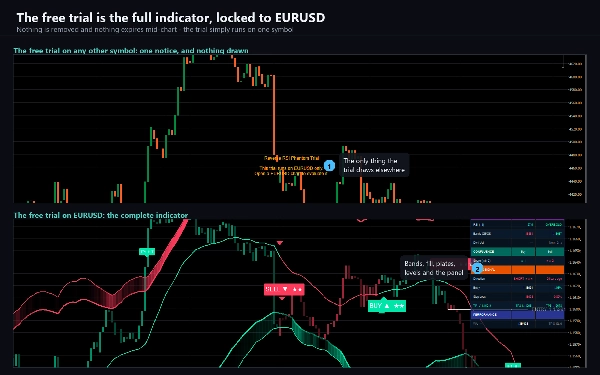
Phiên bản dùng thử miễn phí là chỉ báo đầy đủ trên EURUSD - mọi hậu tố nhà môi giới đều hoạt động. Trên bất kỳ ký hiệu nào khác
nó hiển thị thông báo và không vẽ gì. Không giới hạn thời gian, không giảm lịch sử, không thiếu tính năng. Phiên bản đầy đủ
loại bỏ giới hạn ký hiệu và không thay đổi gì khác.
GHI CHÚ KỸ THUẬT VÀ HẠN CHẾ
Quyền truy cập: không có. Chỉ báo không thể đọc tệp, khởi động tiến trình hoặc mở kết nối riêng.
Nó là công cụ biểu đồ và phân tích. Nó không đặt lệnh và không có quyền truy cập vào tài khoản của bạn.
Hàng HIỆU SUẤT của bảng đếm những gì đã xảy ra trên các cây nến mà biểu đồ của bạn đã tải theo cài đặt hiện tại của bạn. Nó là mô tả lịch sử đó, không phải kiểm tra lại và không phải dự báo.
Tắt bộ lọc xác nhận làm tăng điểm hội tụ thay vì giảm - ba trong năm lớp trao điểm khi bộ lọc của họ bị vô hiệu hóa. Tăng điểm tối thiểu cho phù hợp nếu bạn tắt bộ lọc.
HỖ TRỢ
Các câu hỏi được gửi qua tab Thảo luận. Bao gồm nhà môi giới, ký hiệu, khung thời gian, phiên bản cTrader và
một ảnh chụp màn hình, và bạn sẽ nhận được câu trả lời hữu ích ngay lần đầu tiên.
Giao dịch có rủi ro. Hiệu suất trong quá khứ không đảm bảo kết quả trong tương lai.
Tóm tắt
Key features include:
- Two price bands representing RSI thresholds with gradient fills indicating pressure intensity.
- A midline and candle tinting reflecting the current trend regime.
- Confluence-scored BUY and SELL signals displayed on signal bars with a score out of five.
- A comprehensive trade plan per signal, showing entry, an ATR-based stop loss, and three customizable profit targets.
- Visual markers for trend regime changes and RSI-price divergences.
- An 18-row informational panel summarizing regime, ATR, RSI states, volume, confluence, active trades, and historical performance.
- Configurable settings covering RSI parameters, smoothing, trend filters, confluence thresholds, stop modes, risk targets, divergence lookback, and alert/webhook options.
The indicator operates as an overlay on any instrument and timeframe, requiring volume data for full functionality. Alerts and webhooks can notify users of key events such as signals, trend shifts, targets, and stops. Non-repaint mode ensures signals are fixed once bars close. It is designed for traders who use RSI and seek integrated signals with trade management guidance.
Đánh giá của khách hàng
5 | 100 % | |
4 | 0 % | |
3 | 0 % | |
2 | 0 % | |
1 | 0 % |