


Description
Flux Gate Precision reads the range the market has actually traded in, and tells you when price commits to one end of it.
How it finds a signal
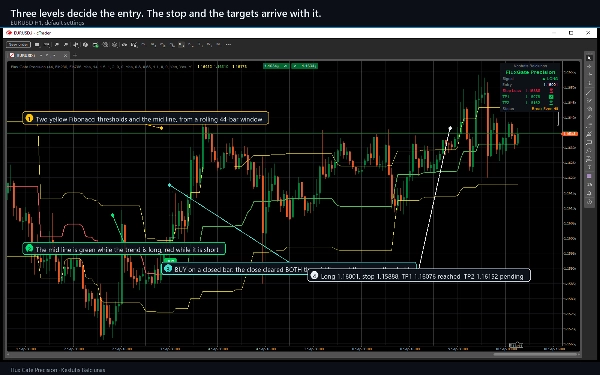
A rolling window of the last 44 candles gives the highest high and the lowest low. Three levels are measured down from that high: an upper Fibonacci threshold at 23.6 percent, a mid line at 50 percent, and a lower threshold at 78.6 percent. The indicator draws all three, and colours the mid line green while the trend is long and red while it is short.
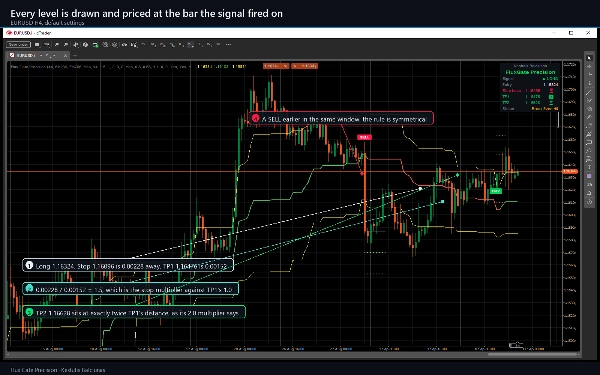
A BUY needs a bar to close above BOTH the mid line and the upper threshold. A SELL needs a close below BOTH the mid line and the lower threshold. Requiring two levels rather than one is what keeps it quiet while price oscillates around the middle of the range. A trend state also has to change hands: it will not print a second BUY until a SELL has intervened, so you do not get a cluster of the same signal in one move.
Every decision is made on a CLOSED bar. A marker never appears and then disappears.
What comes with the signal
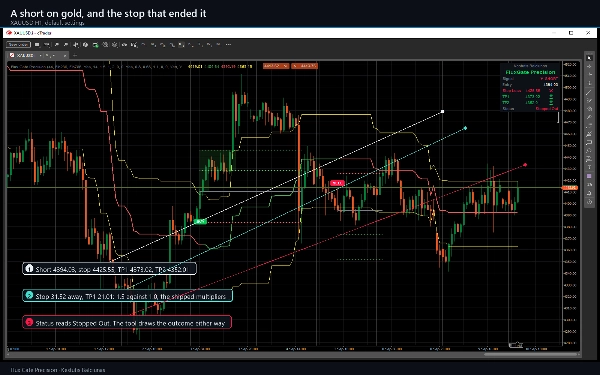
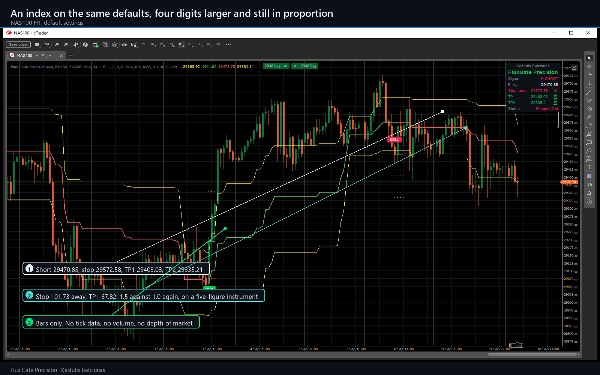
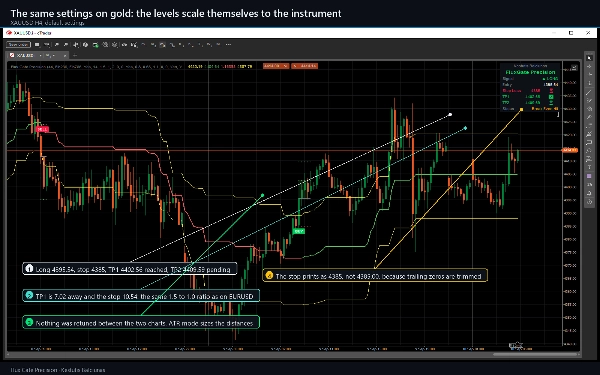
The moment a signal prints, the indicator fixes an entry, a stop and up to four take profits, and draws each one as a labelled line carrying its price.
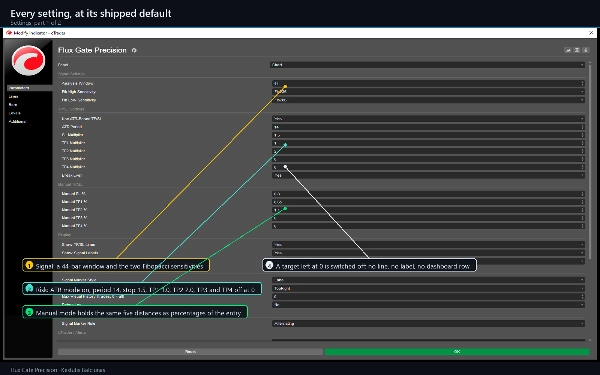
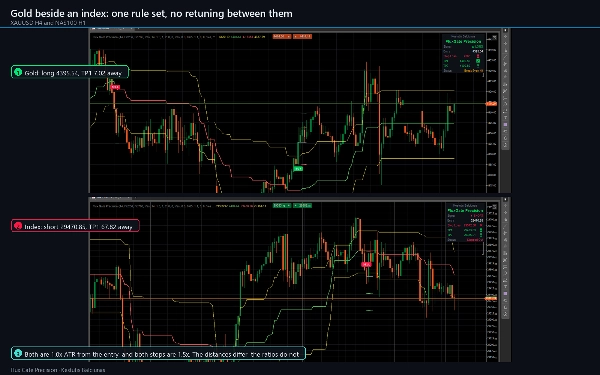
- ATR mode, on by default, sizes the stop and the targets from current volatility, so the same settings behave sensibly on a five minute chart and on a daily one, and on a currency pair and on gold.
- Manual mode sizes them as a fixed percentage of the entry price instead.
- The stop defaults to 1.5 ATR, the first target to 1.0 and the second to 2.0. The third and fourth are off until you give them a multiplier.
The break-even ladder
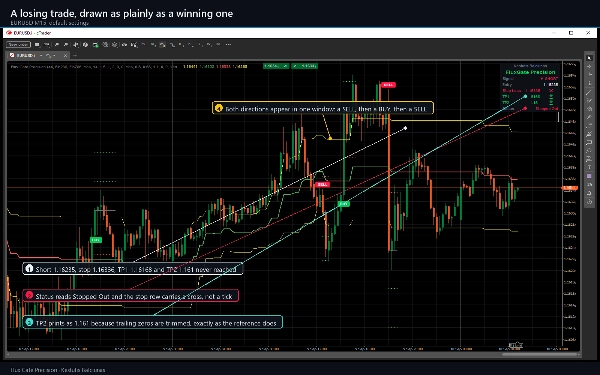
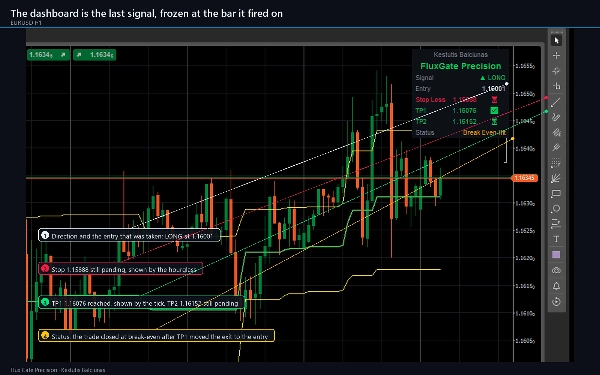
With Break Even on, the exit walks up behind the trade: reaching the first target moves it to the entry, the second moves it to the first target, the third to the second, and reaching the fourth closes the trade. A shaded band is drawn each time a level is reached, so the whole life of a trade stays readable on the chart afterwards.
The dashboard
A panel in the corner of your choice shows the last signal and what has happened to it since: direction, entry, stop, each active target with a tick when price reaches it, and a status line that reads Active, All TPs Hit, Stopped Out, Break Even Hit or Trend Change.
Alerts
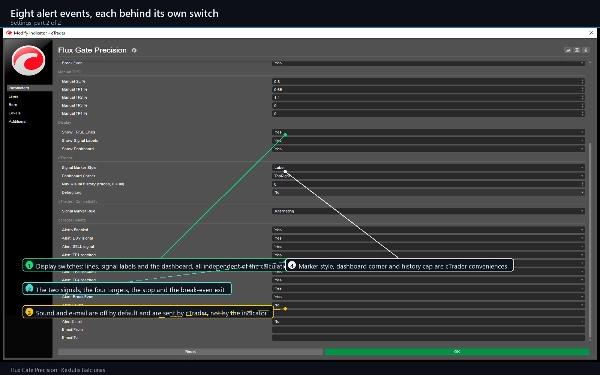
Eight events, each behind its own switch: the two signals, the four targets, the stop and the break-even exit. Each fires once per closed bar and never for history, so attaching it to a long chart does not produce a wall of old alerts. Delivery is the cTrader log, an optional sound, and optional e-mail through your own cTrader settings.
Settings
38 parameters in four groups you will use and three you probably will not touch: the analysis window and the two Fibonacci sensitivities, the ATR mode and its multipliers, the manual percentages, and three display switches. The rest are cTrader conveniences: a marker style, the dashboard corner, a visual history cap, a debug log, and one switch per alert.
Type, timeframes and instruments
An overlay indicator for trend and support and resistance analysis. It needs about 60 bars before it draws, which is short, so it is usable on intraday charts as well as swing charts. M15, H1 and H4 are the window it was designed around; it runs on any timeframe and any instrument, and has been checked on major FX pairs, gold and indices. It uses bars only: no tick data, no volume, no depth of market.
Who it is for
Traders who want an entry rule they can state in one sentence, and who want the stop and the targets decided at the same moment as the entry rather than afterwards.
The trial
The trial edition is this same build with one restriction: it runs on EURUSD only, and broker suffixes such as EURUSD.i are accepted. There is no time limit and every parameter is available. The full version adds every other symbol.
Technical notes
Signals do not repaint: they are evaluated on closed bars only. While a trade is open its level lines and their labels extend to the right with the chart, which moves the drawing, not the levels. During the first few bars of the ATR window the stop and targets sit on the entry price until the average has enough data, and a target left at a multiplier of zero is switched off and gets no line, no label and no dashboard row.
The indicator declares no access rights. It opens no network connection, reads no file, and never places, modifies or closes an order. The ticks on the dashboard record that price touched a drawn level on the loaded history, with no spread, commission or slippage in them.
Support
Questions go through the Discussion tab of this listing. Please include your symbol, timeframe, broker, cTrader version and a screenshot with the dashboard visible.
Trading involves risk. Past performance does not guarantee future results.
Summary
Upon signal generation, the indicator sets entry, stop-loss, and up to four take-profit levels, which are displayed as labeled lines on the chart. The stop and targets can be sized using ATR-based volatility or fixed percentage modes. The break-even ladder adjusts the stop progressively as targets are reached, visually marking each level on the chart.
A dashboard panel shows the latest signal status, including entry, stop, targets, and trade progress. Alerts can be configured for signals, targets, stops, and break-even exits, firing once per closed bar. The indicator works on any timeframe and instrument using bar data only and is suitable for intraday and swing trading. It has been tested on major FX pairs, gold, and indices.


















!["High-Low Divergence [Iridio Capital]" logo](https://cdn.ctrader.com/image/webp/10a9e91b-243a-43f6-bbfe-7376bad5a214_61554)










