
Descrizione
Supply Demand Quadra Zones mette un segnale di ingresso, un piano di rischio tracciato e il contesto più ampio del mercato su un unico grafico.
COSA DISEGNA
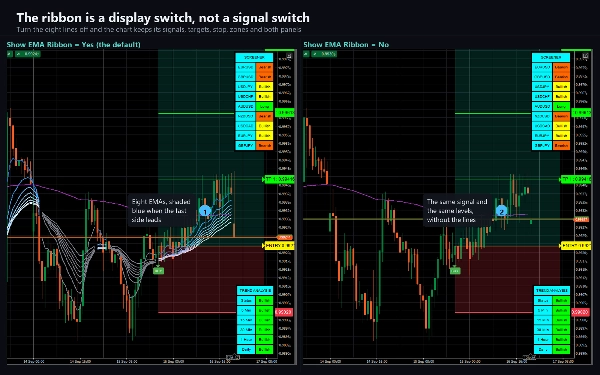
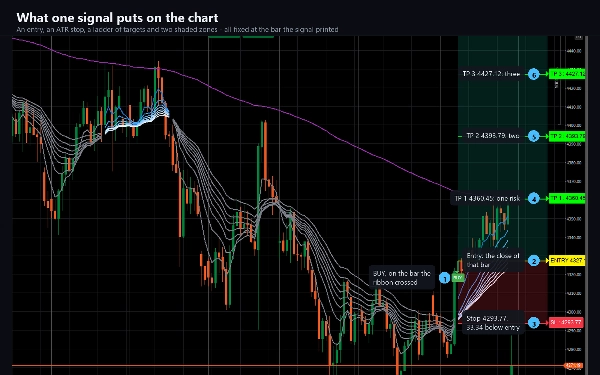
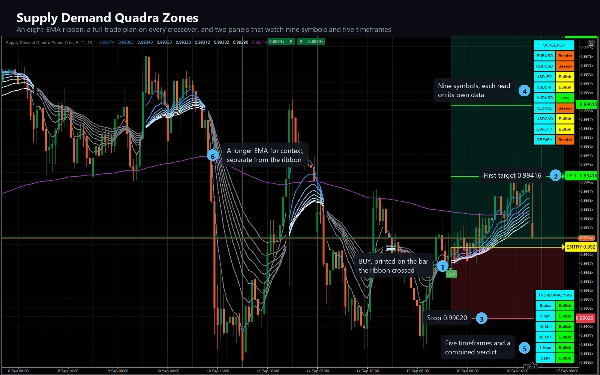
Un nastro EMA a otto linee (5, 11, 15, 18, 21, 24, 28, 34) che diventa blu mentre la gamba veloce guida e grigio quando non lo fa, più una linea di riferimento a 200 periodi. Quando EMA 2 incrocia verso l'alto EMA 8 viene disegnata una piastra BUY; quando incrocia di nuovo appare una piastra SELL.
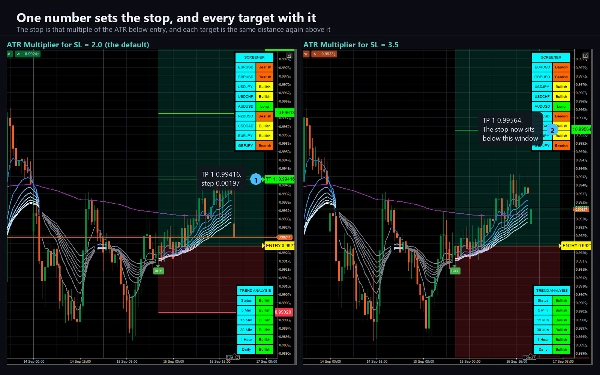
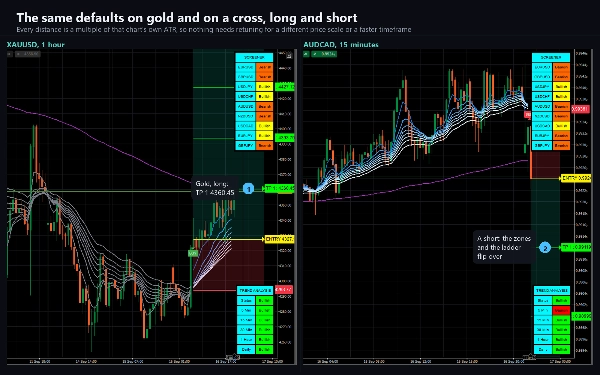
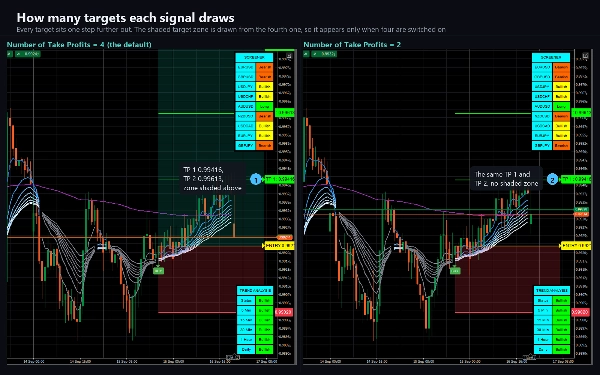
Ogni segnale viene fornito con un piano di rischio completo già sul grafico: una linea di ingresso, uno stop posizionato a un multiplo dell'ATR e fino a quattro livelli di take-profit distanziati come multipli di quella distanza di stop. Nelle impostazioni predefinite la scala è 1R, 2R, 3R e 4R. Ogni livello ha il proprio prezzo indicato sul bordo destro, e lo spazio tra ingresso e obiettivo e tra ingresso e stop è ombreggiato in modo che la forma del trade sia leggibile a colpo d'occhio. L'intero piano si muove in avanti con il prezzo e si blocca quando il trade si risolve - o lo stop viene toccato o ogni obiettivo abilitato è stato raggiunto.
I DUE PANNELLI
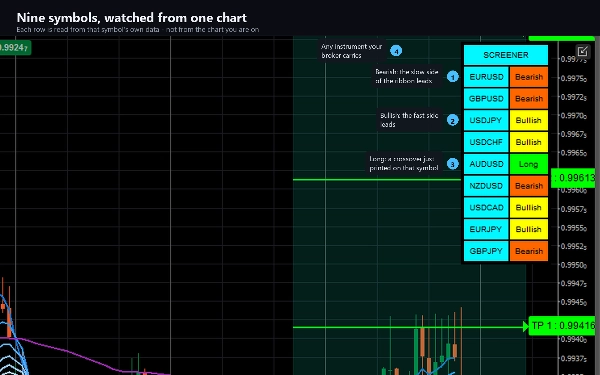
Uno screener classifica fino a nove simboli a tua scelta - tutti letti al timeframe del grafico stesso - come Long, Short, Bullish o Bearish, così puoi vedere quali altri mercati si stanno allineando allo stesso modo senza aprire nove grafici.
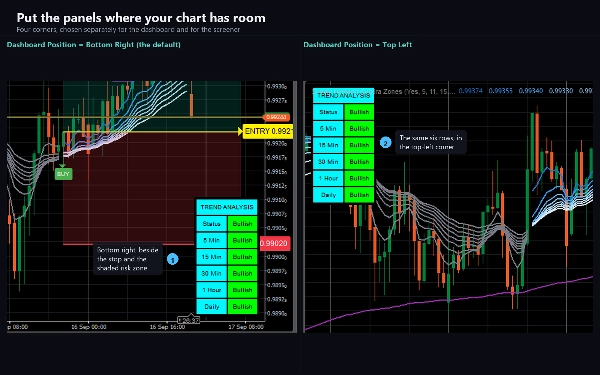
Una dashboard di trend riporta la direzione a 5 minuti, 15 minuti, 30 minuti, 1 ora e giornaliera per il simbolo del grafico, più una riga di Stato combinata decisa a maggioranza da tre timeframe che scegli tu.
WEBHOOK
Ogni segnale, e ogni fase del trade che ne segue, può essere inviato tramite POST come JSON a un URL che scegli tu - così un bot esterno, un diario o un servizio di notifiche possono agire senza che nessuno guardi il grafico. Invia il lato, l'ingresso, lo stop e l'intera scala degli obiettivi, poi un messaggio per ogni obiettivo raggiunto, per lo stop e per la chiusura del trade. È disattivato finché non inserisci l'URL, non si attiva mai durante il caricamento della cronologia o durante un backtest, e non richiede permessi elevati.
Gli alert vengono anche consegnati tramite il log di cTrader, un suono e un'e-mail.
RIPITTURA, DETTO CHIARAMENTE
I segnali BUY e SELL non si ripitturano. Sono decisi su barre chiuse e non si spostano mai una volta disegnati.
I due pannelli si ripitturano. Entrambi sono disegnati sulla barra live e leggono dati in sviluppo di timeframe superiori, quindi le loro celle possono cambiare fino alla chiusura di quelle barre. Trattali come un'immagine live di dove si trovano le cose, non come un registro di ciò che è accaduto.
IMPOSTAZIONI
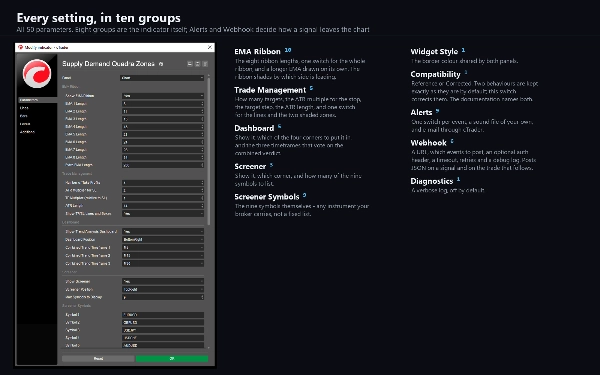
50 parametri. Tutte e otto le lunghezze del nastro, il moltiplicatore ATR e la spaziatura degli obiettivi, il numero di obiettivi, entrambe le posizioni dei pannelli, tutti e nove i simboli dello screener, i tre timeframe della dashboard, il colore del bordo, i canali di alert e il webhook. Un'impostazione di Compatibilità sceglie tra due comportamenti per l'opzione dashboard a 4 ore e la zona obiettivo ombreggiata - la documentazione spiega esattamente cosa fa ciascuno e perché il valore predefinito è quello che è.
ADATTO A
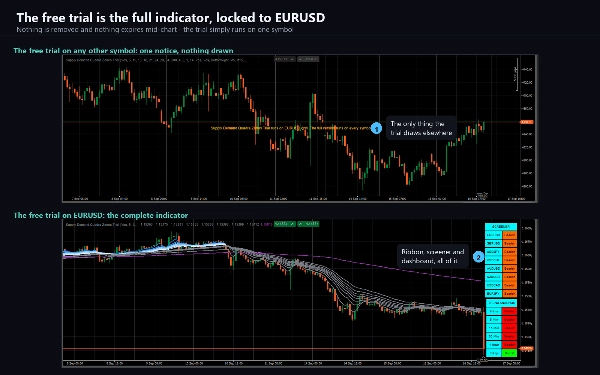
Qualsiasi strumento e qualsiasi timeframe offerti dalla piattaforma. Il nastro necessita di 34 barre prima di essere completamente formato e 200 per la linea di riferimento, quindi storie molto brevi mostreranno meno linee rispetto a una lunga.
Il trading comporta rischi. Le performance passate non garantiscono risultati futuri.
Riepilogo
Each trade signal includes a comprehensive risk plan displayed directly on the chart, consisting of an entry line, a stop loss set at a multiple of the Average True Range (ATR), and up to four take-profit levels spaced by multiples of the stop distance. These levels are visually shaded and labeled with price tags for clarity. The risk plan dynamically tracks price movement and freezes upon trade resolution.
The product also includes two panels: a screener monitoring up to nine user-selected symbols on the current timeframe, classifying them as Long, Short, Bullish, or Bearish; and a trend dashboard showing directional trends across five timeframes (5m, 15m, 30m, 1h, daily) with a combined status based on a majority vote of three user-chosen timeframes.
Signals and trade steps can be sent as JSON via webhook to external services for automation or logging. Alerts are available through platform logs, sound, and email. Buy and sell signals are confirmed on closed bars and do not repaint, while the screener and dashboard update live and may change until bar close. The indicator offers extensive customization with 50 parameters covering ribbon settings, ATR multiples, target spacing, panel positions, symbols, alert channels, and webhook configuration.