
Descrizione
🔥 **PrimeQuant CM Ultimate MACD MTF v1.0** 🔥
**L'aggiornamento MACD perfetto da TradingView a cTrader**
✅ Replica visiva esatta del famoso CM MACD Ultimate MTF Pine Script
✅ Supporto multi-timeframe (grafico corrente o HTF personalizzato)
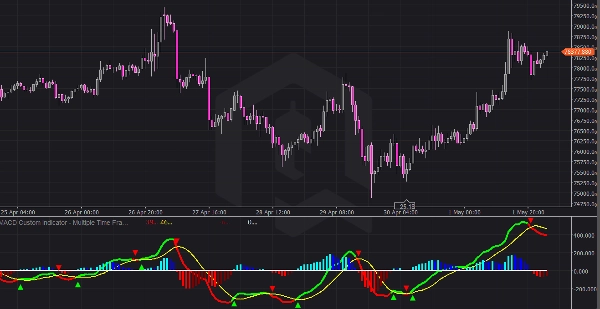
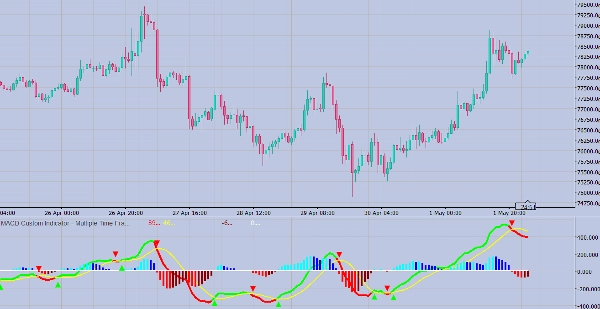
✅ Linea MACD continua con colorazione dinamica verde/rossa del trend
✅ Linea segnale gialla
✅ Istogramma a 4 colori (transizioni sopra/sotto zero)
✅ Segnali a croce triangolari (frecce su/giù con spaziatura perfetta)
✅ Linea di riferimento zero
**🎯 Caratteristiche principali:**
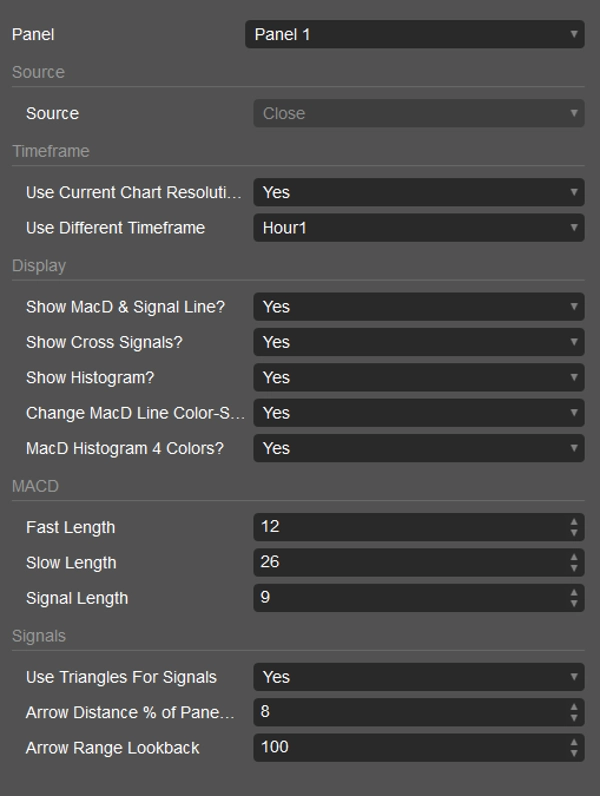
- **📊 Flessibilità MTF**: Usa il timeframe corrente o seleziona un HTF personalizzato (1m-1M)
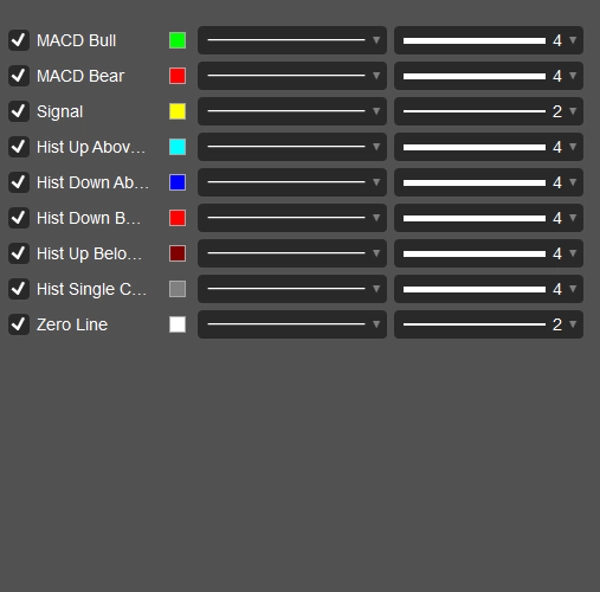
- **🎨 Colorazione intelligente**: La linea MACD cambia verde/rosso al segnale di incrocio
- **📈 Istogramma a 4 colori**: Acquamarina/blu sopra zero, rosso/marrone sotto
- **🔺🔻 Segnali triangolari**: Frecce pulite su/giù nei punti di incrocio
- **⚙️ Personalizzazione completa**: Attiva o disattiva ogni elemento indipendentemente
**🚀 Come usare:**
1. **Aggiungi al grafico** → Appare in un pannello separato
2. **TF corrente** → Seleziona "Usa risoluzione grafico corrente" (default)
3. **TF superiore** → Deseleziona + seleziona timeframe (es. H1 su grafico M5)
4. **Segnali** → Abilita "Mostra segnali di incrocio" per i marcatori triangolari
5. **Personalizza** → Regola colori, distanze, stili dell'istogramma
**📈 Segnali di trading:**
- 🔺 **Triangolo verde verso l'alto** = MACD incrocia SOPRA il segnale (rialzista)
- 🔻 **Triangolo rosso verso il basso** = MACD incrocia SOTTO il segnale (ribassista)
- **MACD verde** = Sopra il segnale (bias rialzista)
- **MACD rosso** = Sotto il segnale (bias ribassista)
- **Divergenza dell'istogramma** = Osserva i cambi di momentum
**💎 Qualità PrimeQuant**
Realizzato per cTrader 5.6.10+ | Zero errori | Prestazioni native | Visual professionali
**⭐ Perfetto per:** Scalper, trader swing, analisi HTF su grafici inferiori
Riepilogo
Recensioni dei clienti
5 | 0 % | |
4 | 100 % | |
3 | 0 % | |
2 | 0 % | |
1 | 0 % |