present
ลงทะเบียนและรับส่วนลด $50 สำหรับการซื้อครั้งแรกของคุณ
Trading product for Break Tracer อินดิเคเตอร์ EMA SMA, image 1
Break Tracer
อินดิเคเตอร์
80 ดาวน์โหลด
เวอร์ชัน 1.0, Sep 2026
Windows, Mac
5.0
รีวิว: 1
Trading product for Break Tracer อินดิเคเตอร์ EMA SMA, image 2
Trading product for Break Tracer อินดิเคเตอร์ EMA SMA, image 3
Trading product for Break Tracer อินดิเคเตอร์ EMA SMA, image 4
Trading product for Break Tracer อินดิเคเตอร์ EMA SMA, image 5
Trading product for Break Tracer อินดิเคเตอร์ EMA SMA, image 6
Trading product for Break Tracer อินดิเคเตอร์ EMA SMA, image 7
Trading product for Break Tracer อินดิเคเตอร์ EMA SMA, image 8
Trading product for Break Tracer อินดิเคเตอร์ EMA SMA, image 9
Trading product for Break Tracer อินดิเคเตอร์ EMA SMA, image 10
Trading product for Break Tracer อินดิเคเตอร์ EMA SMA, image 11
15
การขาย
237
ติดตั้งฟรี

คำอธิบาย

Break Tracer อ่านแนวโน้มในสองชั้นและจะทำงานก็ต่อเมื่อทั้งสองเห็นด้วยกันเท่านั้น


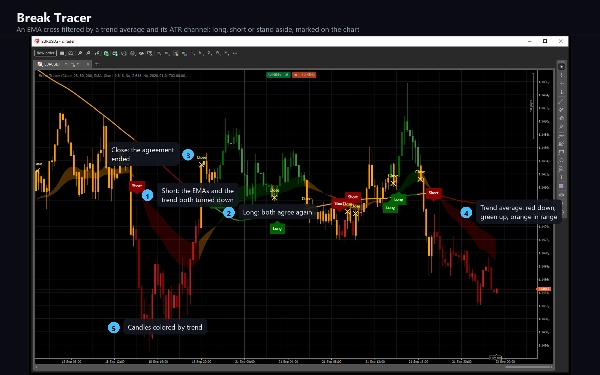
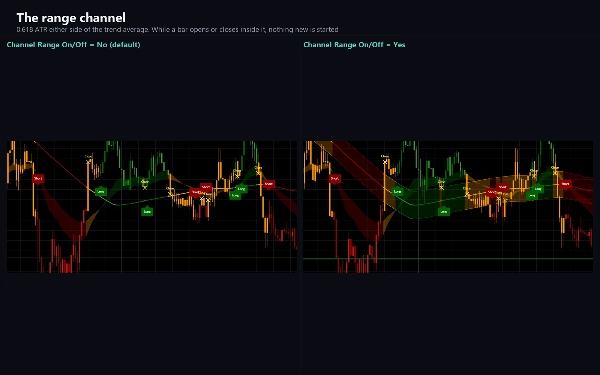
คู่ค่าเฉลี่ยเคลื่อนที่แบบเอ็กซ์โพเนนเชียลที่รวดเร็ว (26 และ 50) ให้ทิศทางระยะสั้น ค่าเฉลี่ยแนวโน้ม 200 แท่ง พร้อมช่องทางของ 0.618 เท่าของช่วงจริงเฉลี่ยรอบๆ มัน ให้แนวโน้ม เมื่อคู่ค่าที่รวดเร็วชี้ขึ้นและราคาสูงกว่าค่าเฉลี่ยแนวโน้ม แนวโน้มจะเป็นขาขึ้น; เมื่อทั้งคู่ชี้ลง จะเป็นขาลง; และในขณะที่แท่งเปิดหรือปิดภายในช่องทาง ตลาดจะถูกพิจารณาว่าอยู่ในช่วงเคลื่อนไหวแบบ Sideways และจะไม่มีการเริ่มต้นใหม่ใดๆ


สิ่งที่คุณเห็น


เส้นแนวโน้มในเฉดสีเขียวหรือแดง ส้มในขณะที่ตลาดอยู่ในช่วงเคลื่อนไหวแบบ Sideways

แถบที่มีเงาระหว่างค่าเฉลี่ยเร็วทั้งสอง ในสีเดียวกัน

แผ่น Long ใต้แท่งที่เริ่มแนวโน้มขาขึ้น และแผ่น Short เหนือแท่งที่เริ่มแนวโน้มขาลง

เครื่องหมายกากบาทสีเหลืองที่ตำแหน่งที่ปิดเพราะแนวโน้มหรือค่าเฉลี่ยเร็วเปลี่ยนทิศทาง

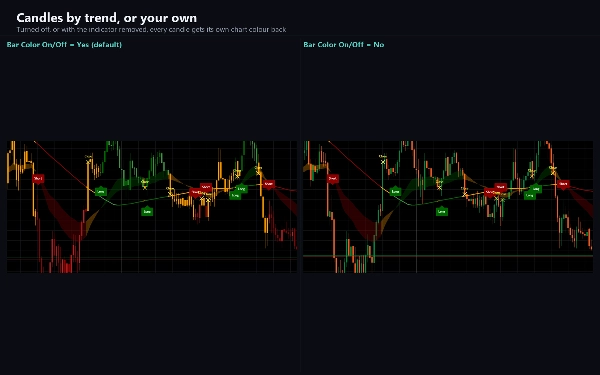
แท่งเทียนที่ลงสีตามแนวโน้ม โดยมีเฉดสีอ่อนกว่าสำหรับแท่งที่ปิดสวนทางกับแนวโน้ม

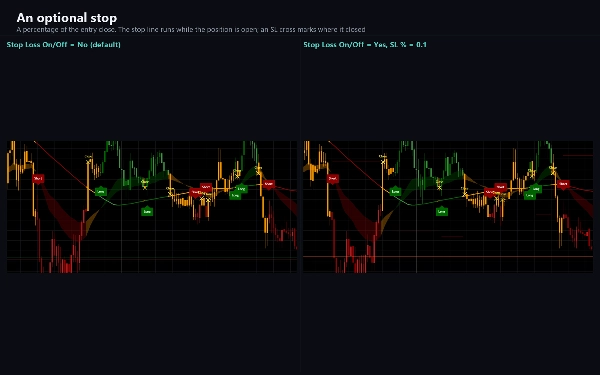
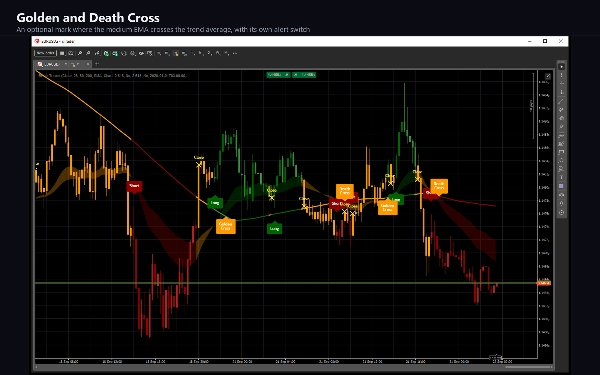
ตัวเลือกเสริม: ช่องทางเอง เส้นหยุดพร้อมเครื่องหมาย SL ที่ระดับที่ปิดตำแหน่ง แผ่น Golden Cross และ Death Cross เมื่อค่าเฉลี่ยกลางตัดกับค่าเฉลี่ยแนวโน้ม และเงาสีเทานอกหน้าต่างวันที่ที่คุณเลือก


วิธีใช้


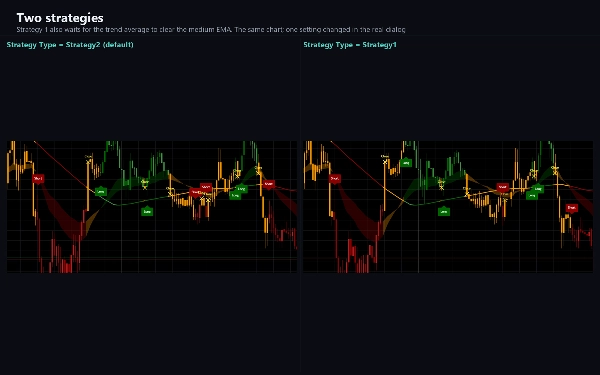
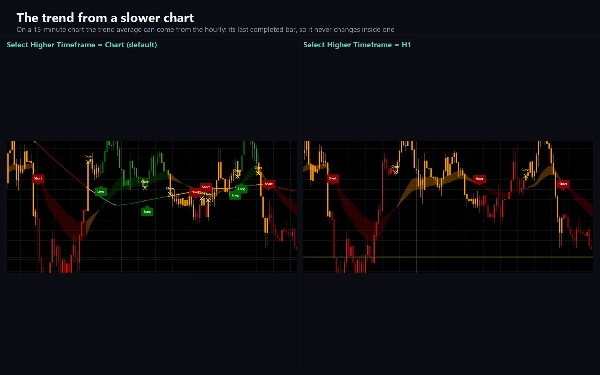
แผ่น Long หรือ Short แสดงช่วงเวลาที่ทั้งสองชั้นเห็นด้วยกัน; เครื่องหมายกากบาทปิดแสดงช่วงเวลาที่พวกเขาไม่เห็นด้วยกันอีกต่อไป กลยุทธ์ 2 ซึ่งเป็นค่าเริ่มต้น จะรับทุกการเห็นด้วย; กลยุทธ์ 1 เข้มงวดกว่าและจะไม่ทำงานในขณะที่ค่าเฉลี่ยแนวโน้มยังอยู่ผิดด้านของค่าเฉลี่ยกลาง สามารถเลือกได้ว่าจะรับเฉพาะ Long, Short หรือทั้งสอง ค่าเฉลี่ยแนวโน้มสามารถนำมาจากกรอบเวลาที่สูงกว่า เช่น ชั่วโมงบนกราฟห้านาที และจะใช้แท่งกรอบเวลาสูงสุดที่เสร็จสมบูรณ์ล่าสุด ดังนั้นจะไม่เปลี่ยนแปลงภายในแท่งนั้น


การตั้งค่า


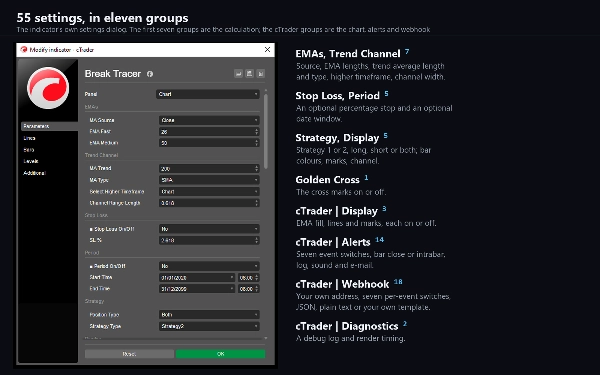
แหล่งข้อมูล ความยาว EMA ความยาวและประเภทของค่าเฉลี่ยแนวโน้ม (SMA หรือ EMA) กรอบเวลาที่สูงกว่า ความกว้างช่องทาง เปอร์เซ็นต์หยุดตัวเลือก หน้าต่างวันที่ตัวเลือก ประเภทกลยุทธ์ และด้านที่เลือกใช้ องค์ประกอบการวาดแต่ละอย่างมีสวิตช์ของตัวเอง และการปิดสวิตช์หนึ่งจะเปลี่ยนแค่การวาดเท่านั้น: ค่าการแจ้งเตือนและ webhook จะยังทำงานต่อไป


การแจ้งเตือนและ Webhook


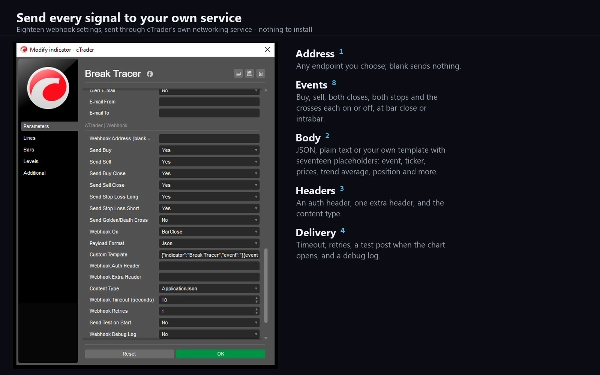
เหตุการณ์หกประเภท: ซื้อ ขาย ปิดซื้อ ปิดขาย หยุดขาดทุน Long และ หยุดขาดทุน Short รวมทั้ง Golden และ Death Cross เป็นตัวเลือก แต่ละเหตุการณ์มีสวิตช์ของตัวเองและสามารถทำงานเมื่อแท่งปิดหรือทันทีที่เงื่อนไขเป็นจริง การส่งข้อมูลเป็นบรรทัดบันทึก เสียง หรืออีเมล นอกจากนี้ยังมี webhook: กรอกที่อยู่และแต่ละเหตุการณ์จะถูกส่งเป็น JSON เป็นข้อความธรรมดา หรือในเทมเพลตที่คุณเขียนเองพร้อมตัวแทนสำหรับสัญลักษณ์ กรอบเวลา เวลา ราคา ค่าเฉลี่ย สถานะแนวโน้ม และตำแหน่ง จะไม่ทำงานจนกว่าคุณจะกรอกที่อยู่ มันจะไม่ส่งอะไรในระหว่างการประมวลผลประวัติหรือการทดสอบย้อนหลัง และไม่ต้องการสิทธิ์พิเศษใดๆ - การโพสต์จะส่งผ่านบริการเครือข่ายของ cTrader เอง


สำหรับ cBOTS


ค่าเฉลี่ยแนวโน้ม ค่าเฉลี่ยเร็วทั้งสอง สถานะแนวโน้ม และสถานะตำแหน่ง ถูกเผยแพร่เป็นชุดข้อมูลผลลัพธ์


ประเภทและหน้าต่าง


ตัวบ่งชี้แนวโน้ม วาดบนกราฟราคา


กรอบเวลาและเครื่องมือ


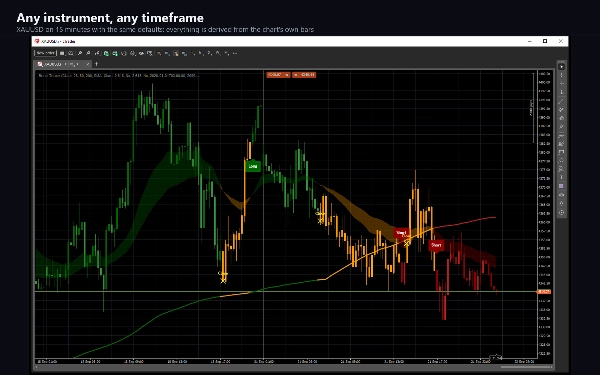
กรอบเวลาที่อิงตามเวลาใดก็ได้ ค่าเริ่มต้นอ่านได้ดีตั้งแต่ M5 ถึง H4 และตัวเลือกกรอบเวลาที่สูงกว่าช่วยให้กราฟกรอบเวลาต่ำตามแนวโน้มที่ช้ากว่าได้ มันทำงานได้กับเครื่องมือใดก็ได้ - คู่ฟอเร็กซ์ โลหะ ดัชนี และคริปโต - เพราะทุกอย่างที่ใช้ได้มาจากแท่งเทียนเอง


สำหรับใคร


เทรดเดอร์ที่ต้องการตัวกรองแนวโน้มที่มองเห็นได้: เมื่อไหร่ควรเปิดสถานะ Long, เมื่อไหร่ควรเปิดสถานะ Short, เมื่อไหร่ควรถอยออก และมีการแจ้งเตือนทุกครั้งที่เปลี่ยนแปลง


หมายเหตุ


เครื่องหมายจะติดตามแท่งที่ยังอยู่ในระหว่างการก่อตัว ดังนั้นอาจปรากฏและหายไปจนกว่าแท่งนั้นจะปิด การแจ้งเตือนและโพสต์ webhook จะตั้งค่าเริ่มต้นที่การปิดแท่ง ซึ่งเงื่อนไขถือเป็นขั้นสุดท้าย บนกราฟใหม่ เครื่องหมายแรกคือ Short ที่แท่งที่สอง เพราะไม่สามารถวัดอะไรได้จนกว่าค่าเฉลี่ยจะมีอยู่


การเทรดมีความเสี่ยง ผลการดำเนินงานในอดีตไม่รับประกันผลลัพธ์ในอนาคต

สรุป

AI summary
Break Tracer is a trend indicator designed for use on price charts across any time-based timeframe, suitable for instruments including forex pairs, metals, indices, and cryptocurrencies. It combines two layers of trend analysis: a fast pair of exponential moving averages (EMAs) with periods 26 and 50 to capture short-term direction, and a slower 200-bar trend average (SMA or EMA) surrounded by an ATR-based channel (0.618 times the average true range) to define the overall trend. The indicator signals a trend only when both layers agree—uptrend when fast EMAs point up and price is above the trend average, downtrend when both point down, and a ranging market when price bars fall inside the ATR channel.

Visual elements include a color-coded trend line (green/red for trend, orange for range), shaded bands between fast EMAs, Long and Short plates marking trend starts, yellow crosses indicating position closes, and candles colored by trend strength. Optional features include the ATR channel display, stop lines with stop-loss crosses, Golden and Death Cross plates, and customizable date window shading.

Break Tracer supports configurable strategies for trade entries and exits, higher timeframe trend averaging, and selective long/short signals. It provides six alert events (Buy, Sell, Close, Stop Loss, Golden/Death Cross) with customizable delivery via log, sound, email, or webhook posting JSON or templated messages. Output series for cBots include trend averages and position states. Settings allow adjustment of sources, lengths, channel width, stop percentages, and visual elements independently.
โปรไฟล์อินดิเคเตอร์
หมวดหมู่อินดิเคเตอร์
Trend
ประเภทเอาต์พุต
การแสดงเป็นภาพ
สัญญาณ
ข้อกำหนดด้านข้อมูล
แท่งเท่านั้น
สัญญาณที่รองรับ
Cross
เบรก Level ที่ระบุ

รีวิวจากลูกค้า

5.0
รีวิว: 1
5
100 %
4
0 %
3
0 %
2
0 %
1
0 %
รีวิวจากลูกค้า
October 1, 2026

การสนทนา

คำถามที่พบบ่อย

EMA
SMA
Channel
ATR
Moving Average
ผลิตภัณฑ์ที่มีให้บริการผ่าน cTrader Store รวมถึงบอทการเทรด อินดิเคเตอร์ และปลั๊กอิน มีให้บริการโดยนักพัฒนาบุคคลที่สามและมีไว้เพื่อวัตถุประสงค์ในการเข้าถึงข้อมูลและทางเทคนิคเท่านั้น cTrader Store ไม่ใช่โบรกเกอร์และไม่ได้ให้คำแนะนำการลงทุน คำแนะนำส่วนบุคคล หรือการรับประกันผลการดำเนินงานในอนาคต

เพิ่มเติมจากผู้เขียนคนนี้

อินดิเคเตอร์
ATR
CCI
+4
A trend line that never steps back, a shaded band to the price, and a pointer at the swing where the trend turns.
cBot
Balanced
Fixed Lot
+5
Gold grid cBot for XAUUSD H1: four-signal confluence on closed bars, ladders closed at a basket profit, news filter
15.6%
ROI
2.33
อัตราส่วน กำไรต่อขาดทุน
อินดิเคเตอร์
ATR
RSI
+5
Fusion trend line with a layered cloud, BULL and BEAR labels, scored re-entry triangles and exit markers.
อินดิเคเตอร์
ATR
RSI
+4
RSI bands drawn on price, confluence-scored BUY/SELL signals, an ATR stop with three targets
อินดิเคเตอร์
ADX
ATR
+5
EMA-cross signals scored on six confluence layers, with an ATR stop, three targets and a live panel
อินดิเคเตอร์
ATR
RSI
+4
Adaptive Ichimoku with nine-factor confluence scoring, five signal types, smart TP/SL and an MTF panel.
อินดิเคเตอร์
ATR
Volume
+3
Fibonacci trend signals on closed bars, with an ATR stop, up to four targets and a break-even ladder.
อินดิเคเตอร์
ADX
ATR
+5
SuperTrend signals scored on five confluence factors, with an ATR stop, three targets and a dashboard.
อินดิเคเตอร์
ATR
EMA
+2
Eight-EMA ribbon with ATR trade zones, a nine-symbol screener and a five-timeframe trend dashboard.
cBot
TP Manager
Break Even
+5
Gold cBot for prop-firm accounts: pick your firm, phase and size; risk is sized from the firm's rules, its limits kept
1.6
อัตราส่วน กำไรต่อขาดทุน
อินดิเคเตอร์
ADX
ATR
+5
Ten confluence layers scored on every closed bar, with an anti-chop gate, pivot levels and a live dashboard.
cBot
Channel
Fixed Lot
+5
Gold breakout cBot for XAUUSD M1: H4 high/low channel, RSI veto, one recovery step and a max drawdown close-all
20%
ROI
4.42
อัตราส่วน กำไรต่อขาดทุน

นอกจากนี้คุณยังอาจชอบ

อินดิเคเตอร์
Moving Average
An Indicator made for scalping. Shows you the Sniper movement on Chart with the colour signals.
อินดิเคเตอร์
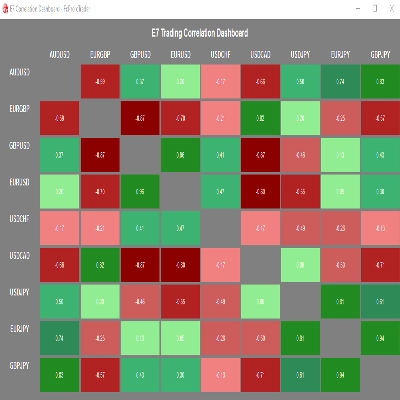
E7 Correlation Dashboard.
อินดิเคเตอร์
Forex
Crypto
+5
📈 Initial Balance Breakout Signals: visually accurate IB levels, breakout alerts & forecast zones for smart trading.
อินดิเคเตอร์
ADX
ATR
+5
EMA-cross signals scored on six confluence layers, with an ATR stop, three targets and a live panel
อินดิเคเตอร์
MSS
Volume
+3
Rejection-based volume profile with tiered heat zones, POC levels and a fully draggable anchor on cTrader.
อินดิเคเตอร์
RSI
MACD
+4
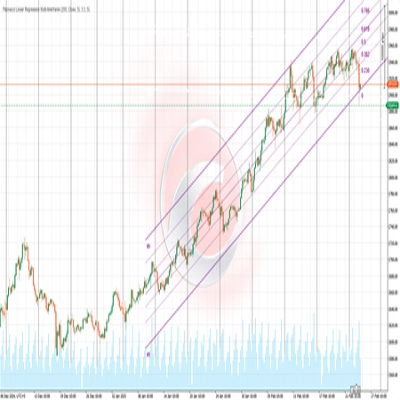
Combining Fibonacci levels and regression to analyze multidimensional market trends across multiple timeframes¡
"Binary Options Signals Pro" โลโก้
ยอดนิยม
4.6
(3)
$49
อินดิเคเตอร์
ATR
RSI
+5
Binary Options Signals Pro – Precision Trading at Your Fingertips
"VegaXLR - ZigZag Alerts" โลโก้
ยอดนิยม
4.3
(3)
$20
อินดิเคเตอร์
Forex
cTrader ZigZag Alerts: Precision Swing Detection, Alerts, and Fibonacci.
อินดิเคเตอร์
Crypto
Signal
+3
Candlestick Signal Finder: cTrader indicator that automatically detects and color-codes key Japanese candlestick pattern
"Simple ICT Concepts" โลโก้
ยอดนิยม
4.6
(3)
$19
/
$34
อินดิเคเตอร์
Forex
BTCUSD
+5
Simple ICT Concepts
อินดิเคเตอร์
VWAP
Volume
+4
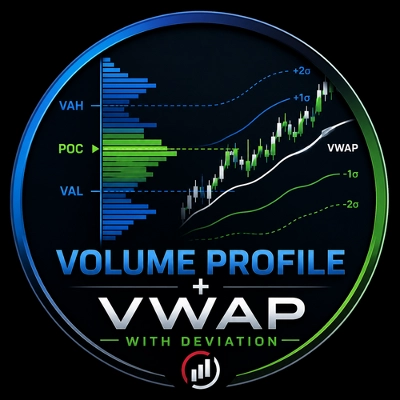
Volume Profile + VWAP with Standard Deviations
"TradeLens" โลโก้
ใหม่
5.0
(1)
$29
/
$49
อินดิเคเตอร์
CHOCH
Inducement
+5
TradeLens - Frame the Trade. Refine the Entry. Two Timeframes. One Decision.
อินดิเคเตอร์
SMC
Forex
+5
Detect institutional breakout zones with smart volume & channel analysis — by PrimeQuant.
อินดิเคเตอร์
Forex
BTCUSD
+11
VMM Average Median - Advanced Median Indicator with Smart Trend Detection.
อินดิเคเตอร์
RSI
VWAP
+5
📈 Anchored VWAP with auto High/Low, session resets, Daily VWAP & TWAP — precise, Pine-accurate port.
"FVG_tidypips" โลโก้
ยอดนิยม
4.3
(3)
$19
อินดิเคเตอร์
XAUUSD
Commodities
A Fair Value Gap (FVG) indicator that identifies potential price imbalances, potential reversal and continuation zones
อินดิเคเตอร์
Supertrend
Moving Average
Easy Trade: Trend & Breakout Indicator for cTrader
อินดิเคเตอร์
Doji
Flag
+5
Angora Pattern Recognition is a cTrader indicator that finds, draws and tracks classic chart patterns automatically.

ราคา

15
การขาย
237
ติดตั้งฟรี