
Descrizione
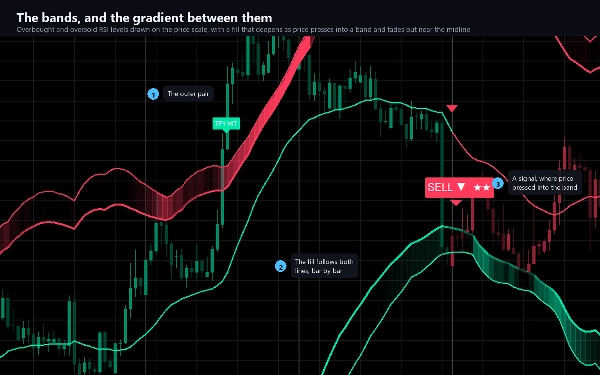
Reverse RSI Phantom capovolge l'RSI. Invece di disegnare l'oscillatore in un pannello sotto il
grafico, risolve la formula RSI al contrario e pone una domanda diversa: quale prezzo porterebbe
l'RSI esattamente a 70, e quale prezzo lo porterebbe a 30? Questi due prezzi sono disegnati sul grafico come
bande, e si muovono ad ogni barra.
Questo cambiamento mette l'intero oscillatore sulla scala dei prezzi, dove puoi vederlo contro le
candele, contro i tuoi livelli, e contro il piano che l'indicatore disegna per te.
COSA DISEGNA
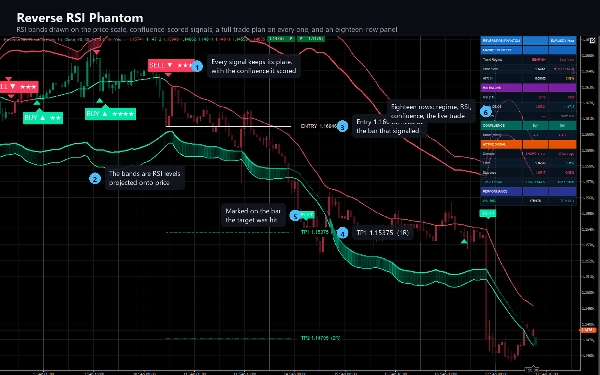
- Due bande e i loro bordi esterni, ai livelli di ipercomprato e ipervenduto che scegli, proiettati sul
prezzo e opzionalmente smussati.
- Un riempimento a gradiente all'interno di ogni banda che si intensifica man mano che il prezzo preme su di essa e svanisce completamente
vicino alla linea mediana, così il grafico ti indica dove è la pressione senza un singolo numero.
- Una linea mediana che porta il colore del regime di tendenza.
- Candele tinte dallo stesso regime, così la direzione è leggibile a colpo d'occhio.
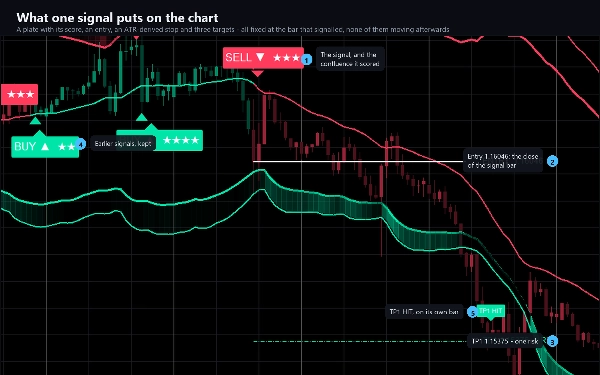
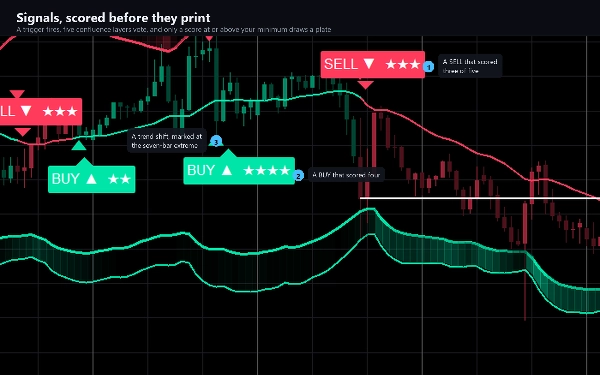
- Una targhetta su ogni barra segnale - BUY o SELL - con la confluenza ottenuta, su cinque.
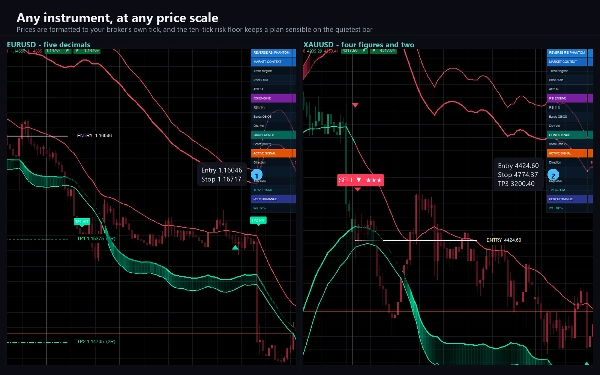
- Un piano di trading completo sulla barra segnale: l'entrata, uno stop derivato dall'ATR, e tre obiettivi a multipli di rischio
che imposti. Cinque linee e cinque etichette di prezzo, tutte fissate alla barra che ha segnalato.
- Una targhetta sulla barra che raggiunge ogni obiettivo, e sulla barra che tocca lo stop.
- Triangoli dove il regime di tendenza cambia, e segni dove l'RSI diverge dal prezzo.
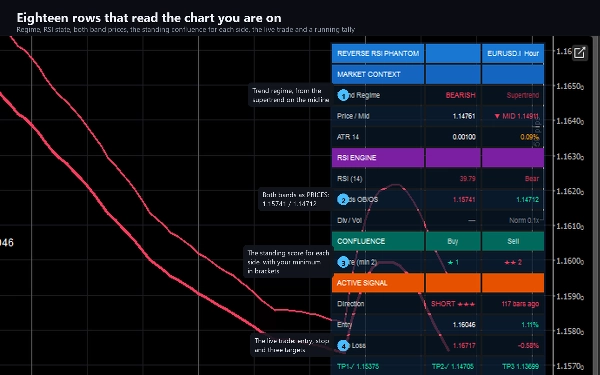
- Un pannello di diciotto righe: regime, prezzo rispetto alla linea mediana, ATR, RSI e il suo stato, entrambe le bande come
prezzi, divergenza, volume, la confluenza attuale per ogni lato, il trade live con la sua entrata,
stop e tre obiettivi, e un conteggio in corso di ciò che ha fatto la storia del grafico.
COME DECIDE
Un segnale non è una sola condizione. Scatta un trigger - il regime cambia, il prezzo attraversa una banda, o una
divergenza si conferma - e poi cinque livelli di confluenza votano: il regime, una conferma RSI, un retest della banda, una divergenza, e un controllo del volume. Il punteggio va da 0 a 5, è mostrato come stelle sulla targhetta, e
deve raggiungere il minimo che imposti prima che qualcosa venga disegnato. Un cancello di tendenza e un filtro di cooldown per direzione filtrano ciò che resta, e se entrambi i lati qualificano sulla stessa barra vince il punteggio più alto.
La modalità Non-Repaint è attiva di default: una barra viene giudicata solo una volta chiusa, quindi una targhetta che appare
non si sposta mai e non scompare mai.
IMPOSTAZIONI CHIAVE
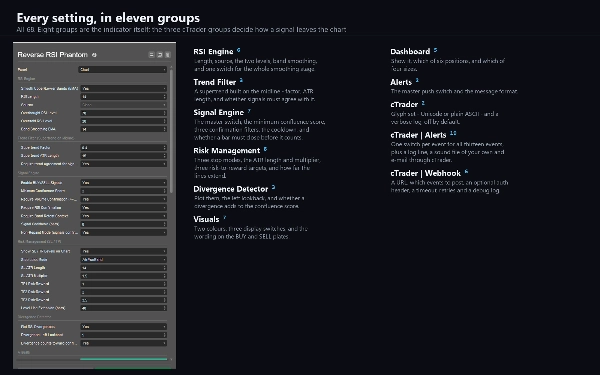
68 in undici gruppi. Lunghezza RSI, fonte e i due livelli; smussatura della banda; fattore del filtro supertrend e lunghezza ATR; punteggio minimo di confluenza e tre filtri di conferma; cooldown del segnale; tre modalità di stop con lunghezza e moltiplicatore ATR; tre obiettivi rischio-ricompensa; lookback della divergenza; due colori e la scritta sulle targhette; posizione e dimensione del pannello; e tre gruppi solo per cTrader per avvisi e webhook.
AVVISI E WEBHOOK
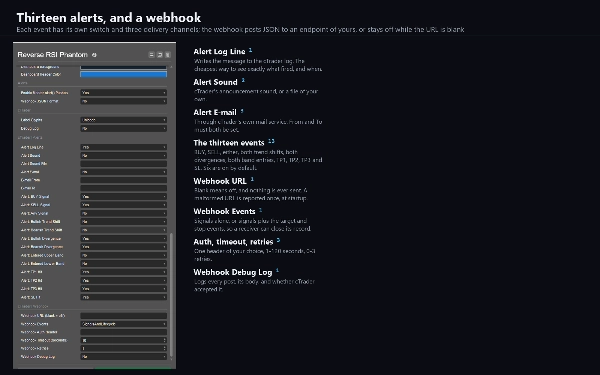
Tredici eventi, ognuno con il proprio interruttore: BUY, SELL, uno o l'altro, entrambi i cambi di tendenza, entrambe le divergenze,
entrambi gli ingressi alle bande, tutti e tre gli obiettivi e lo stop. Consegnati come linea di log cTrader, un suono a tua scelta, e e-mail. Nulla scatta mentre l'indicatore percorre la storia del grafico, e nulla scatta in
un backtest.
Un webhook invia gli stessi eventi come JSON a qualsiasi indirizzo tu scelga - un bot di trading, un diario, un
relay, un flusso di automazione. Rimane spento finché non ne inserisci uno, è deduplicato per evento per barra,
è limitato a venti messaggi al minuto, e un errore viene registrato anziché lanciato. Invia
tramite il servizio di rete di cTrader, motivo per cui l'indicatore non necessita di diritti di accesso a file o rete.
TIPO E FINESTRA
Un indicatore overlay: tutto è disegnato sul grafico dei prezzi, e non aggiunge un pannello separato.
TIMEFRAME E STRUMENTI
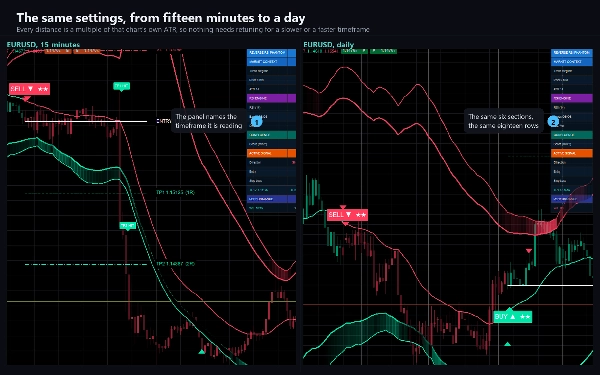
Qualsiasi. Ogni distanza che disegna è un multiplo dell'ATR del grafico stesso, e i prezzi sono formattati al tick del tuo
broker, quindi non serve riadattare nulla tra un grafico a quindici minuti e uno giornaliero, o
tra una coppia FX a cinque decimali e l'oro a quattro cifre. M15 a H4 è l'intervallo su cui è stata
effettuata la maggior parte dei test.
Il volume è richiesto: uno dei cinque livelli di confluenza lo legge.
CASI D'USO
- Leggere la pressione di ipercomprato e ipervenduto dove deve stare, sulla scala dei prezzi.
- Prendere ingressi di mean-reversion a una banda con il regime di tendenza come filtro.
- Trasformare un segnale in un piano: uno stop e tre obiettivi, disegnati prima di agire.
- Guardare un grafico e essere avvisati, tramite linea di log, suono, e-mail o webhook, quando succede qualcosa.
A CHI È DESTINATO
Trader che già usano l'RSI e lo vogliono dove guardano, e chiunque voglia un segnale che venga
con uno stop e un set di obiettivi invece che una freccia.
PROVA
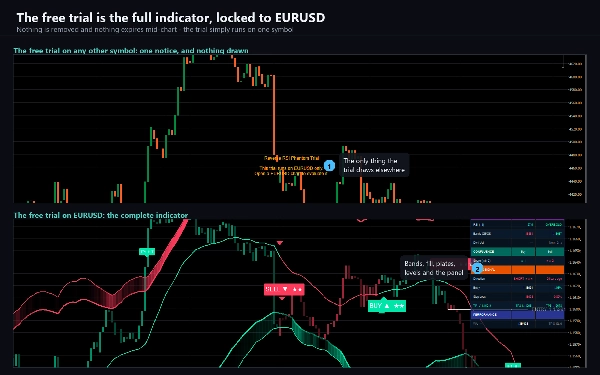
La prova gratuita è l'indicatore completo solo su EURUSD - ogni suffisso broker funziona. Su qualsiasi altro simbolo
mostra un avviso e non disegna nulla. Nessun limite di tempo, nessuna storia ridotta, nessuna funzione mancante. La versione completa rimuove la restrizione sul simbolo e non cambia altro.
NOTE TECNICHE E LIMITAZIONI
Diritti di accesso: nessuno. L'indicatore non può leggere file, avviare processi o aprire connessioni da solo.
È uno strumento di grafico e analisi. Non piazza ordini e non ha accesso al tuo conto.
La riga PERFORMANCE del pannello conta ciò che è successo sulle barre caricate dal tuo grafico con le impostazioni attuali. È una descrizione di quella storia, non un backtest e non una previsione.
Disattivare un filtro di conferma aumenta il punteggio di confluenza invece di diminuirlo - tre dei
cinque livelli assegnano il loro punto quando il loro filtro è disabilitato. Aumenta il punteggio minimo di conseguenza se
disattivi i filtri.
SUPPORTO
Le domande vanno tramite la scheda Discussione. Includi il tuo broker, simbolo, timeframe, versione di cTrader e
uno screenshot, e riceverai una risposta utile al primo tentativo.
Il trading comporta rischi. Le performance passate non garantiscono risultati futuri.
Riepilogo
Key features include:
- Two price bands representing RSI thresholds with gradient fills indicating pressure intensity.
- A midline and candle tinting reflecting the current trend regime.
- Confluence-scored BUY and SELL signals displayed on signal bars with a score out of five.
- A comprehensive trade plan per signal, showing entry, an ATR-based stop loss, and three customizable profit targets.
- Visual markers for trend regime changes and RSI-price divergences.
- An 18-row informational panel summarizing regime, ATR, RSI states, volume, confluence, active trades, and historical performance.
- Configurable settings covering RSI parameters, smoothing, trend filters, confluence thresholds, stop modes, risk targets, divergence lookback, and alert/webhook options.
The indicator operates as an overlay on any instrument and timeframe, requiring volume data for full functionality. Alerts and webhooks can notify users of key events such as signals, trend shifts, targets, and stops. Non-repaint mode ensures signals are fixed once bars close. It is designed for traders who use RSI and seek integrated signals with trade management guidance.
Recensioni dei clienti
5 | 100 % | |
4 | 0 % | |
3 | 0 % | |
2 | 0 % | |
1 | 0 % |