CursorbyteAutoFib v2
Индикатор
Версия 1.0, Apr 2025
Windows, Mac
Описание
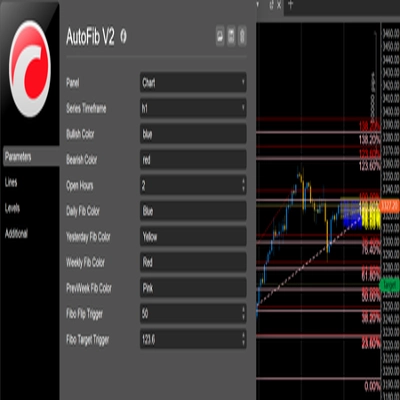
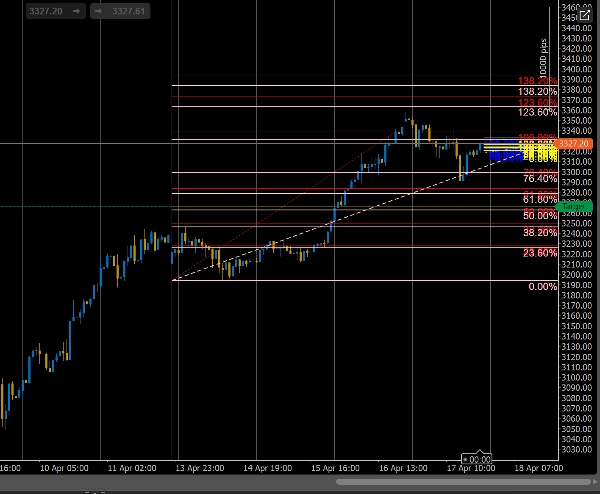
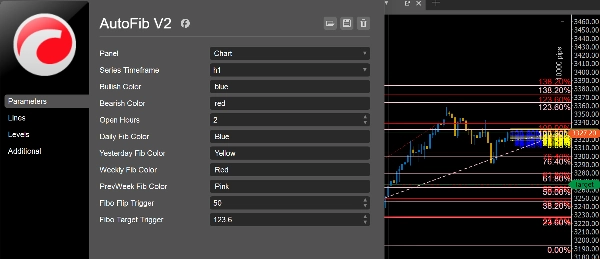
Этот индикатор cTrader автоматически строит уровни коррекции и расширения Фибоначчи на основе последних колебаний цены. Он помогает трейдерам определить потенциальные зоны поддержки, сопротивления и цели, облегчая планирование входов, выходов и размещения стоп-лоссов с точностью.
Сводка
Профиль индикатора
Отзывы покупателей
0.0
Отзывы: 0
Отзывы покупателей
У этого продукта еще нет отзывов. Уже попробовали его? Поделитесь впечатлениями!
Обсуждение
Частые вопросы
Продукты, доступные в cTrader Store, включая торговых ботов, индикаторы и плагины, предоставляются сторонними разработчиками и доступны исключительно в информационных и технических целях. cTrader Store не является брокером и не предоставляет инвестиционные консультации, персональные рекомендации или какие-либо гарантии будущей доходности.


Цена
С 31/10/2024
56
Продажи
1.75K
Бесплатные установки