
Описание
📊 Панель ежедневного диапазона пунктов (инструмент ADR, выровненный по сессиям)
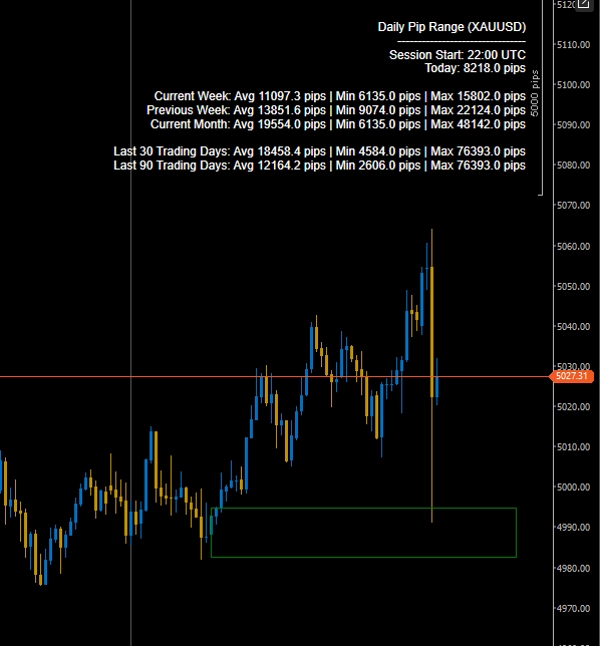
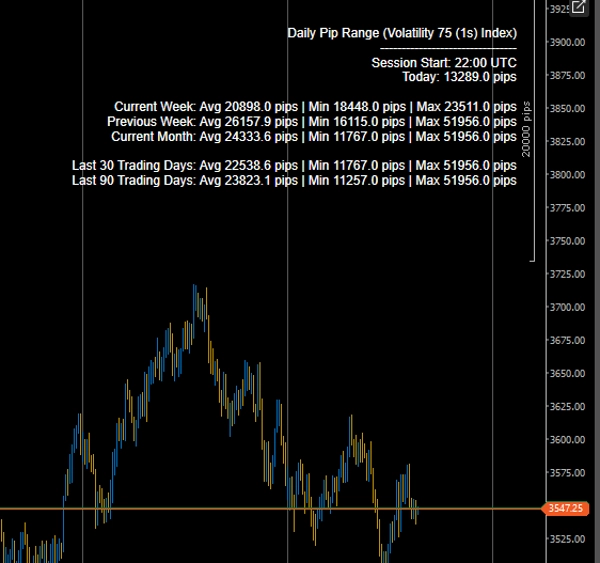
The Панель ежедневного диапазона пунктов — это профессиональный торговый инструмент, который отображает статистику дневного диапазона в реальном времени прямо на вашем графике — полностью синхронизированную с сессией вашего брокера по UTC.
Разработанный для точных трейдеров, этот инструмент вычисляет диапазон пунктов High-Low, используя истинные дневные границы, основанные на сессиях, и предоставляет мощную скользящую статистику для анализа рыночного контекста и волатильности.
🔥 Ключевые особенности
✅ Текущий дневной диапазон в реальном времени (High–Low в пунктах)
Просматривайте обновления диапазона пунктов текущей сессии в реальном времени.
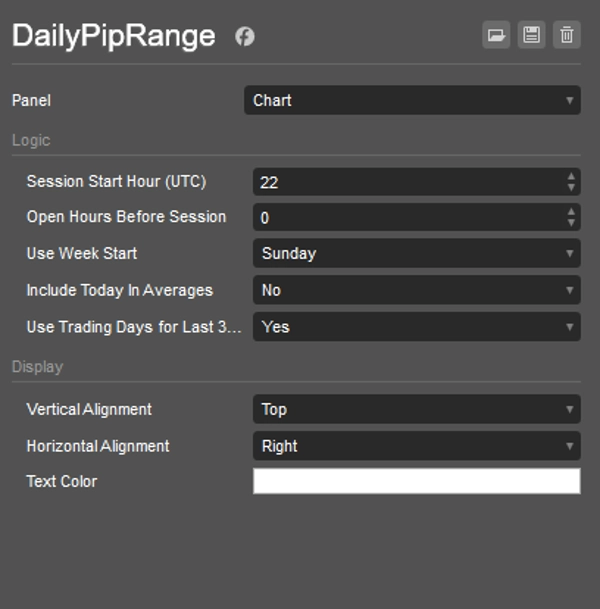
✅ Вычисления, выровненные по сессиям (управление по UTC)
Определите:
- Час начала сессии (UTC)
- Часы открытия до сессии
Это гарантирует, что ваша дневная статистика соответствует торговому дню вашего брокера — идеально для выравнивания по NY Close и институционального анализа.
✅ Расширенный статистический разбор
Для каждого периода индикатор показывает:
- Средний дневной диапазон
- Минимальный дневной диапазон
- Максимальный дневной диапазон
Включённые периоды:
- Текущая неделя
- Предыдущая неделя
- Текущий месяц
- Последние 30 дней
- Последние 90 дней
✅ Переключатель торговых или календарных дней
Выбирайте между:
- Последние 30/90 календарных дней
- Последние 30/90 торговых дней (только дневные бары)
Идеально подходит для исключения выходных и неторговых разрывов.
✅ Настраиваемый дисплей
- Регулируемое положение на экране (вверху справа и т.д.)
- Настройка цвета текста
- Лёгкий и ненавязчивый оверлей
🎯 Почему стоит использовать этот инструмент?
- Определяйте расширение и сжатие волатильности
- Сравнивайте сегодняшний диапазон с историческими средними
- Обнаруживайте сжатие перед прорывами
- Фильтруйте сделки на основе контекста ADR
- Улучшайте размер риска в зависимости от условий волатильности
Независимо от того, торгуете ли вы внутри дня, свингом или золотом, этот инструмент предоставляет вам мгновенную информацию о волатильности без загромождения.
⚙️ Идеально подходит для
- Трейдеров на рынке Форекс
- Трейдеров золота (XAUUSD)
- Трейдеров индексов
- Систем, основанных на волатильности
- Трейдеров прорывов
- Институционального анализа диапазонов
🚀 Профессиональное понимание волатильности — прямо на вашем графике
Создан для производительности, точности и точности сессий.
Сводка
Отзывы покупателей
5 | 50 % | |
4 | 50 % | |
3 | 0 % | |
2 | 0 % | |
1 | 0 % |


