Penerangan
Garis Tinggi & Rendah ADR
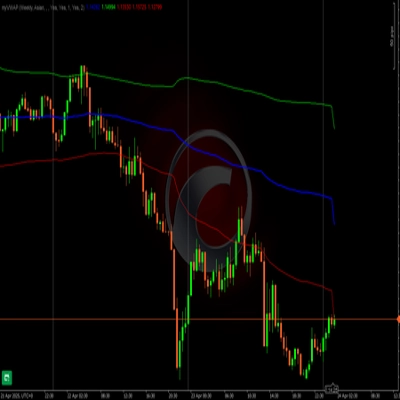
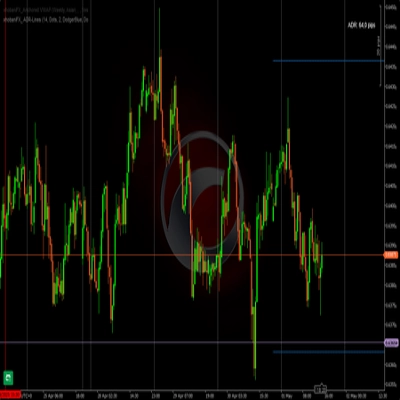
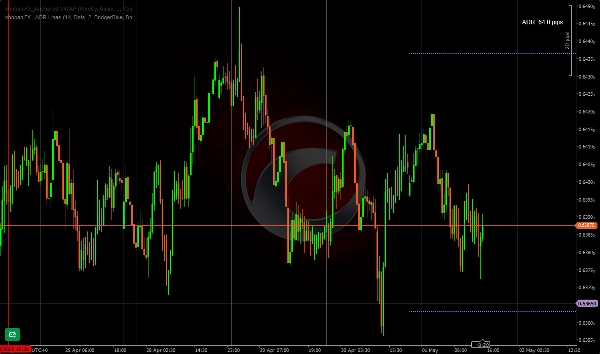
Penunjuk ADR ini melukis garis mendatar untuk rendah/tinggi hari semasa berdasarkan tempoh yang disukai oleh pedagang. Saya suka dan menggunakan 14 hari sebagai tempoh asas. Ia paling sesuai untuk scalper/pedagang intrahari. Jadi anda boleh dengan mudah perhatikan apabila tinggi/rendah telah dicapai, anda boleh memilih warna/gaya/lebar garis untuk berubah kepada warna lain pilihan anda setelah dicapai.
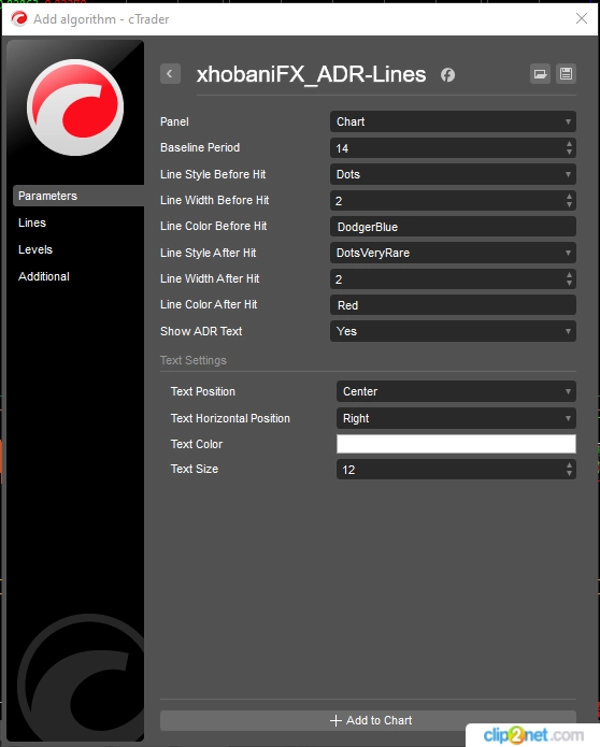
Penunjuk ini dibangunkan sedemikian rupa supaya anda boleh menyesuaikan kebanyakan parameternya untuk memenuhi keutamaan anda dan selaras dengan ruang kerja dan warna anda.
Selamat berdagang!
xhobani_FX
Ringkasan
Ringkasan AI
xhobaniFX_ADR-Lines is an Average Daily Range (ADR) indicator designed for scalpers and intraday traders. It plots horizontal lines representing the current day's high and low levels based on a user-defined period, with 14 days commonly used as a baseline. The indicator visually highlights when these high or low levels are reached by allowing customization of line color, style, and width to change upon being hit. Most parameters are adjustable to fit individual trading preferences and workspace aesthetics. This tool aids traders in quickly identifying key price levels within the trading day.
Profil indikator
Ulasan pelanggan
4.0
Ulasan: 2
5 | 0 % | |
4 | 100 % | |
3 | 0 % | |
2 | 0 % | |
1 | 0 % |
Perbincangan
Soalan Lazim
Produk yang tersedia melalui cTrader Store, termasuk bot dagangan, indikator dan plugin, disediakan oleh pembangun pihak ketiga dan diberikan akses untuk tujuan maklumat dan teknikal sahaja. cTrader Store bukan broker dan tidak memberikan nasihat pelaburan, syor peribadi atau sebarang jaminan prestasi masa hadapan.