Logo „POC session line”
Wskaźnik
Wersja 1.1, Jan 2026
Windows, Mac
5.0
Opinie: 2
Przesłany obraz „POC session line”
Od 21/04/2025

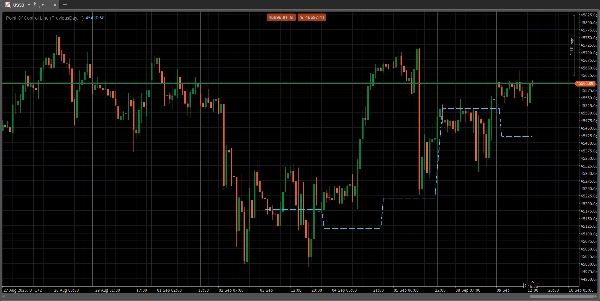
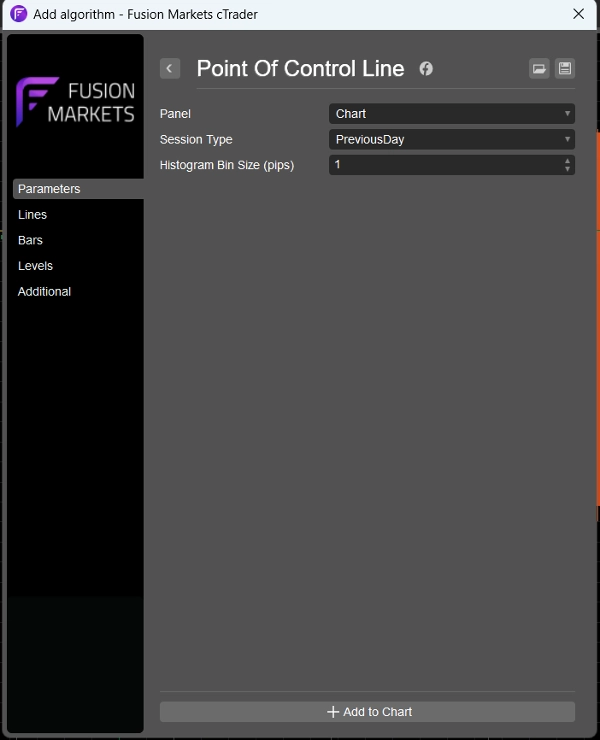
Punkt Kontroli (POC) to poziom cenowy na wykresie profilu wolumenu, na którym w określonym okresie przeprowadzono największy wolumen obrotu. Ten poziom działa jako istotna strefa wsparcia lub oporu, ponieważ reprezentuje cenę, przy której największe instytucje handlowe były najbardziej aktywne i gdzie cena rynkowa znalazła konsensus. Traderzy używają POC do identyfikacji kluczowych stref cenowych, oceny nastrojów rynkowych oraz przewidywania potencjalnych ruchów i odwróceń cen.

Usunąłem cały szum z typowych wskaźników profilu wolumenu, pozostawiając tylko linię POC dla tych, którzy potrzebują jedynie tej linii. Dołączyłem parametr umożliwiający wyświetlanie linii POC dla profilu wolumenu z poprzedniego dnia, 4 godzin lub 1 godziny, dzięki czemu jest to odpowiednie dla traderów działających na różnych ramach czasowych.

Profil wskaźnika
5.0
Opinie: 2
5
100 %
4
0 %
3
0 %
2
0 %
1
0 %
Opinie klientów
September 16, 2025
The log becomes easier to read, but impatience can still break the idea.
September 15, 2025
Forex
Indices
Produkty dostępne za pośrednictwem cTrader Store, w tym boty handlowe, wskaźniki i wtyczki, dostarczane są przez deweloperów zewnętrznych i udostępniane wyłącznie w celach informacyjnych oraz w celu zapewnienia dostępu technicznego. cTrader Store nie jest brokerem i nie zapewnia doradztwa inwestycyjnego, nie udziela spersonalizowanych rekomendacji ani nie gwarantuje przyszłych wyników.

Możesz także polubić

Wskaźnik
Forex
BTCUSD
+13
Sniper Zone Pro: High-precision institutional zones and candle strength for identifying key market tests.
Wskaźnik
AI
ATR
+20
Detects smart money activity using advanced tick volume and price divergence analysis.
Wskaźnik
Market Structure
Support & Resistance
Auto-centers price when it moves beyond threshold. Adjustable zoom. Works on any chart type. Never lose price again.
Wskaźnik
RSI
BTCUSD
+5
Identify market structure effortlessly with swing highs, lows, CHoCH, and BOS levels for smart trading decisions! 📊🔍"
Wskaźnik
Inside Bar
Save time by lighting a candle to look within yourself in another temporality
Wskaźnik
RSI
MACD
This indicator is a combination of MACD and RSI into one. This is perfect fusion and powerful indicator ever.
Wskaźnik
RSI
SMA
+1
TradingView RSI replica for cTrader with dynamic gradients, automatic divergence detection, and alerts.
Wskaźnik
SMC
Prop
+4
📈 Trading Sessions Indicator — London, New York & Tokyo Visualize Key Market Sessions + High/Low Levels with Precision
Wskaźnik
EMA
RSI
+5
MACD Colour Histogram with 11 Moving Average Types, Multi-timeframe confirmation and Sound Signal Alert.
Wskaźnik
AI
Grid
+17
Clean 3D, Sleek Candles for Trend Patterns.
Wskaźnik
RSI
MACD
+7
The ZigZag indicator is a technical analysis tool primarily used to identify key price reversal points.
Wskaźnik
EMA
Supertrend
+4
Dynamic dual MA cloud indicator. Identifies trends, crossovers, and pullback entries in real time for any asset.
Wskaźnik
VWAP
Forex
+12
Unlock VWAP in cTrader! Choose anchor periods, price sources, and display deviation bands with real-time tick updates.
Wskaźnik
AI
ATR
+12
The standard Relative Strength Index (RSI), RSI & Signal Cloud, Smart Volatility Filter (ATR), On-Chart Info Dashboard
Wskaźnik
MSS
Market Structure
NY HTF Candles is a precision panel designed specifically for institutional traders
Wskaźnik
Volume
Key Levels
+4
Session & Kill Zone Highlighter - Visual tool for London, NY, Tokyo, Sydney sessions plus ICT Kill Zones.
Wskaźnik
Forex
EURUSD
+3
Forex Strength Meter for cTrader: 4 custom currencies, cross alerts, visual arrows. Trade smarter!
Wskaźnik
Shows daily and sessions highs / lows and session boxes, everything configurable
Od 21/04/2025