
LogicLadder Pivots – 고급 시장 구조 및 패턴 스캐너
LogicLadder Pivots로 시장의 숨겨진 구조를 해제하세요.
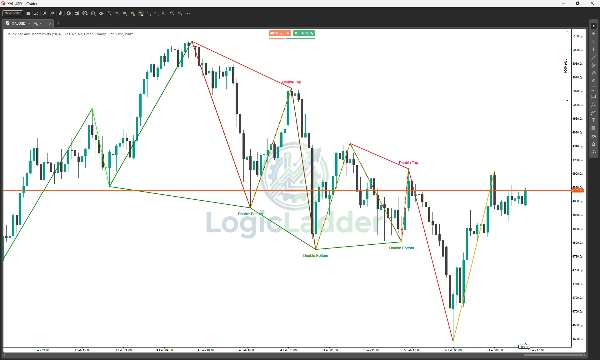
이 LogicLadder Pivots 지표는 거래자가 시장 구조를 시각화하고, 추세를 식별하며, 고확률 반전 패턴을 자동으로 포착할 수 있도록 설계된 전문 등급 가격 행동 도구입니다. 고전적인 ZigZag 논리와 고급 다중 타임프레임 모니터링을 결합하여, 이 도구는 개인 시장 분석가 역할을 하며 차트를 깔끔하게 유지하면서 중요한 가격 움직임을 알려줍니다.
🚀 주요 기능
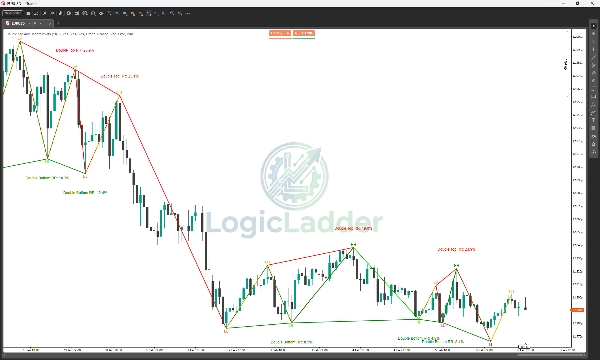
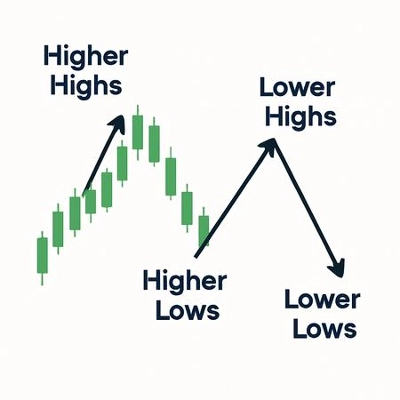
- 자동 시장 구조: 자동으로 Higher Highs (HH), Lower Highs (LH), Higher Lows (HL), 그리고 Lower Lows (LL)를 라벨링하여 현재 추세 방향을 즉시 파악할 수 있습니다.
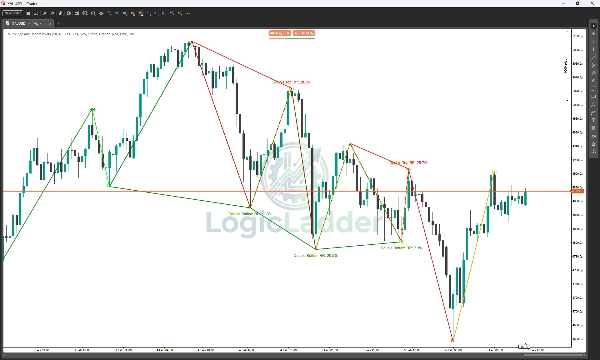
- 스마트 패턴 감지: 실시간으로 Double Top 및 Double Bottom 형성을 스캔합니다. 단순히 패턴을 찾는 것이 아니라 계산된 Risk-to-Reward (RR) 비율을 기반으로 필터링하여 가장 실행 가능한 설정만 표시합니다.
- 다중 타임프레임 (MTF) 알림: 낮은 타임프레임에서 거래하면서 더 높은 타임프레임(예: H4 또는 Daily)을 모니터링합니다. 주요 피벗이 감시 타임프레임에 형성될 때 알림을 받아 주요 추세에 역행하는 거래를 방지합니다.
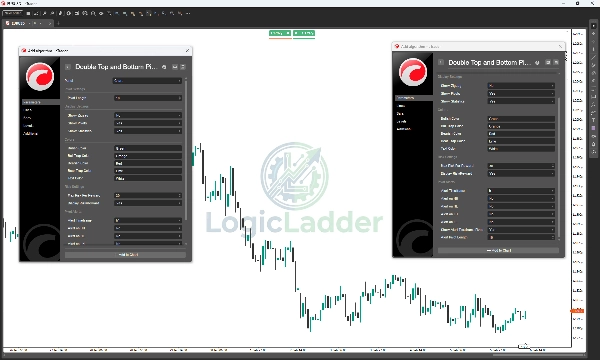
- 인터랙티브 통계 패널: 깔끔한 차트 내 대시보드가 패턴 감지 상태(스캔 중, 더블 탑 감지 등)를 표시합니다.
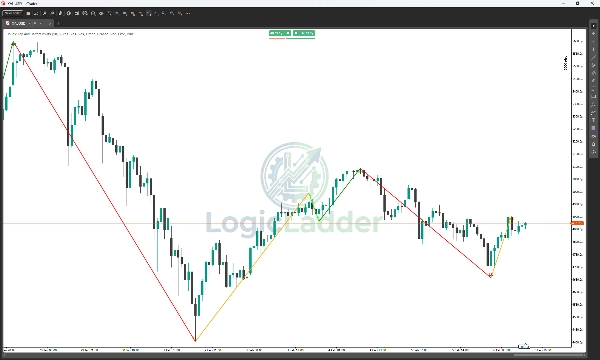
- ZigZag 시각화: 노이즈를 제거하는 명확하고 사용자 정의 가능한 추세선을 그려 중요한 가격 변동에 집중할 수 있도록 도와줍니다.
- 완전 사용자 정의 가능: 지표의 모든 측면을 거래 스타일에 맞게 조정하세요. 피벗 민감도(길이)를 조절하고, 강세/약세 구조의 색상을 변경하며, 시각적 요소를 켜거나 끌 수 있습니다.
🎨 시각 가이드 및 색상 전략
이 LogicLadder 시스템은 특정 4가지 색상 코드를 사용하여 시장 구조의 이야기를 즉시 전달합니다. "사다리"를 읽는 방법은 다음과 같습니다:
1. 🟢 녹색 (강세 - 강함)
- 정의: Higher Highs (HH)에 사용됩니다.
- 의미: 매수자가 완전히 통제하고 있으며, 시장이 새로운 고점을 형성하고 있습니다.
- 행동: 매수 기회를 찾거나 기존의 롱 포지션을 유지하세요.
2. 🔴 빨강 (약세 - 강함)
- 정의: Lower Lows (LL)에 사용됩니다.
- 의미: 매도자가 완전히 통제하고 있으며, 시장이 새로운 저점을 기록하고 있습니다.
- 행동: 매도 기회를 찾거나 기존의 숏 포지션을 유지하세요.
3. 🟠 주황 (강세 함정 - 약함)
- 정의: Lower Highs (LH)에 사용됩니다.
- 의미: 매수자가 가격을 올리려 했으나 이전 고점을 돌파하지 못했습니다. 이는 "강세 함정"으로, 늦게 진입한 매수자가 모멘텀 약화로 갇히게 됩니다.
- 행동: 경고 신호! 롱 포지션이라면 이익 실현을 고려하세요. 하락 추세 반전을 주시하세요.
4. 🟢 라임 (약세 함정 - 강함)
- 정의: Higher Lows (HL)에 사용됩니다.
- 의미: 매도자가 가격을 내리려 했으나 이전 저점을 돌파하지 못했습니다. 이는 "약세 함정"으로, 지지가 유지되어 늦게 진입한 매도자가 갇히게 됩니다.
- 행동: 기회 신호! 이는 종종 새로운 상승 추세의 시작을 알립니다. 롱 진입 신호를 주시하세요.
📉 "사다리" 거래 방법
- 상승 추세 모드: 녹색 (HH)가 라임 (HL)과 연결된 패턴을 보고 싶습니다. 이는 건강한 상승 사다리를 확인시켜 줍니다.
- 하락 추세 모드: 빨강 (LL)이 주황 (LH)과 연결된 패턴을 보고 싶습니다. 이는 급격한 하락 사다리를 확인시켜 줍니다.
- 반전 포착:
-
- 잠재적 고점: 만약 녹색 (HH) 다음에 바로 주황 (LH)이 나타난다면, 상승 추세가 힘을 잃고 있는 것입니다.
- 잠재적 저점: 만약 빨강 (LL) 다음에 바로 라임 (HL)이 나타난다면, 매도 압력이 소진된 것입니다.
💡 작동 원리
- 피벗 분석: 지표는 사용자 정의된 조회 기간(기본값: 10봉)을 분석하여 중요한 스윙 고점과 저점을 식별합니다.
- 추세 논리: 이 점들을 연결하여 가격의 "사다리"를 시각화하며, 추세가 구조를 깨거나 지지/저항을 존중하는 시점을 정확히 보여줍니다.
- 반전 확인: 가격 행동이 "W"(더블 바텀) 또는 "M"(더블 탑) 구조를 형성하고, 위험/보상 기준을 충족하면, 지표가 차트에 패턴을 그리고 상태 패널을 업데이트합니다.
🔔 알림 및 통지
화면을 계속 응시하지 않고도 정보를 유지하세요. LogicLadder Pivots는 강력한 알림 시스템을 포함합니다:
- 로그 알림: 패턴이나 피벗이 발생할 때 cTrader 로그에 상세 메시지를 출력합니다.
- MTF 모니터링: 선택한 알림 타임프레임에서 구조적 피벗 고점 또는 저점이 형성될 때 알림을 받습니다(예: 5분 차트에서 스캘핑하면서 4시간 피벗 저점 알림 받기).
⚙️ 매개변수
- 피벗 길이: 스윙 감지의 민감도.
- 라벨 오프셋: 텍스트 라벨이 캔들 윅에서 떨어진 거리를 조정하여 가시성을 높입니다.
- 최대 위험 대비 보상: 효율성에 따라 패턴을 필터링합니다(기본값: 30%).
- 알림 타임프레임: 모니터링할 보조 타임프레임을 선택하세요.
- 시각 설정: 강세, 약세, 함정 움직임에 대한 색상을 완전히 제어할 수 있습니다.
지표 프로필
0.0
리뷰: 0
고객 리뷰
이 상품에 대한 리뷰가 아직 없습니다. 이미 사용해 보셨나요? 다른 사람들에게 가장 먼저 소개해 주세요!
Signal
ZigZag
Scalping
트레이딩 봇, 지표, 플러그인 등 cTrader Store에서 제공되는 상품은 제3자 개발자에 의해 제공되며, 이는 단순히 정보 및 기술적 접근을 목적으로 제공된 것입니다. cTrader Store는 중개인이 아니며, 투자 조언, 개인별 추천 또는 향후 성과에 대한 어떠한 보장도 제공하지 않습니다.
이 작성자의 상품 더 보기


좋아하실 만한 다른 항목


가입일 09/01/2026
673
무료 설치