Açıklama
Grafiğinizi gereksiz grafiklerle dolduran ve aşırı sistem kaynakları tüketen aşırı yüklü hacim profili göstergelerini unutun.
Yıllar boyunca birçok farklı VP göstergesi kullandım ve bunlara önemli miktarda para harcadım. Hiçbiri aradığım sadelik ve kalite dengesini sunmadı, bu yüzden kendi yaklaşımımı geliştirmeye karar verdim.
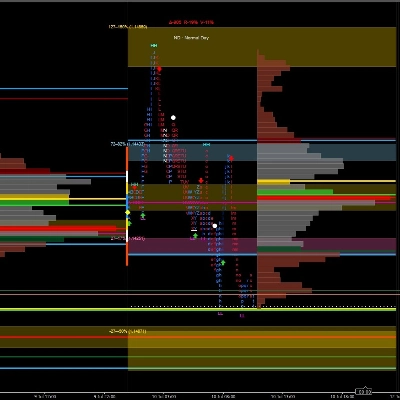
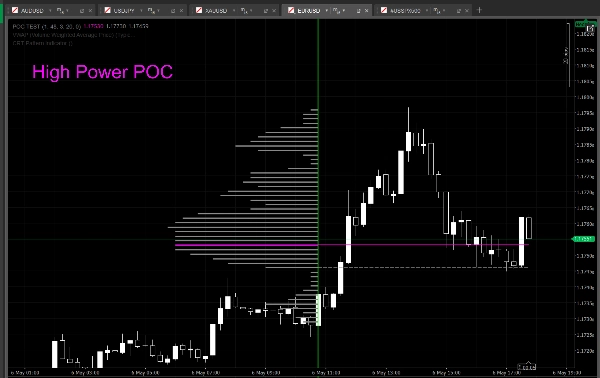
Göstergeleri grafiğe eklediğinizde, yalnızca tek bir dikey çizgi görünür. Bu çizgi, hesaplamanın başladığı mum çubuğunu temsil eder. Seçilen mumdan sonraki Yüksek / Düşük noktalar gösterge tarafından otomatik olarak algılanır ve profil aralığı sınırlarını dinamik olarak belirlemek için kullanılır. Histogram ile birlikte POC / VAH / VAL seviyeleri anında oluşturulur.
Tek yapmanız gereken, başlangıç çizgisini istediğiniz muma sürüklemek ve gerekirse giriş ayarlarından Birim Dakika sınırını tanımlamaktır. Çizgi mumlara mıknatıs gibi yapıştığı için yanlış hizalama veya kazara yanlış kullanım neredeyse imkansızdır.
Bu kadar basit.
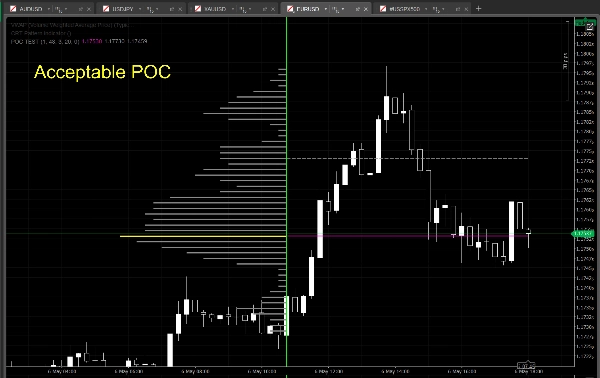
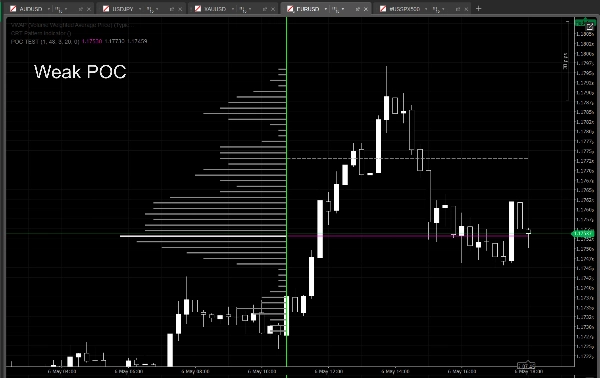
POC'ye karşılık gelen histogram çizgisi, POC gücünü temsil etmek için 3 farklı renk kullanır:
- Beyaz → Zayıf POC
- Sarı → Kabul edilebilir / dengeli POC
- Macenta → Güçlü POC
Önemli not:
Başlangıç çizgisinin yerleştirildiği mum hesaplamaya DAHİL DEĞİLDİR. Profil, seçilen mumdan sonraki mumdan başlar.
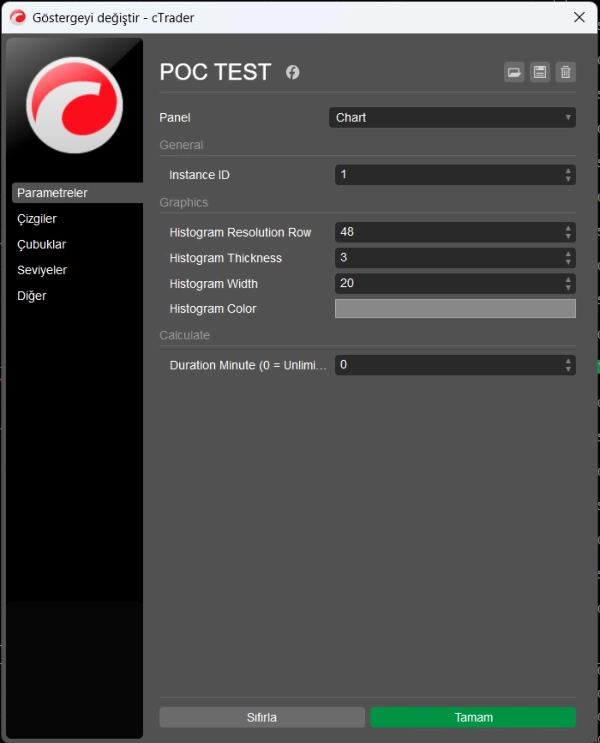
Aynı grafikte farklı Instance ID değerleri kullanarak birden fazla bağımsız profil oluşturabilirsiniz.
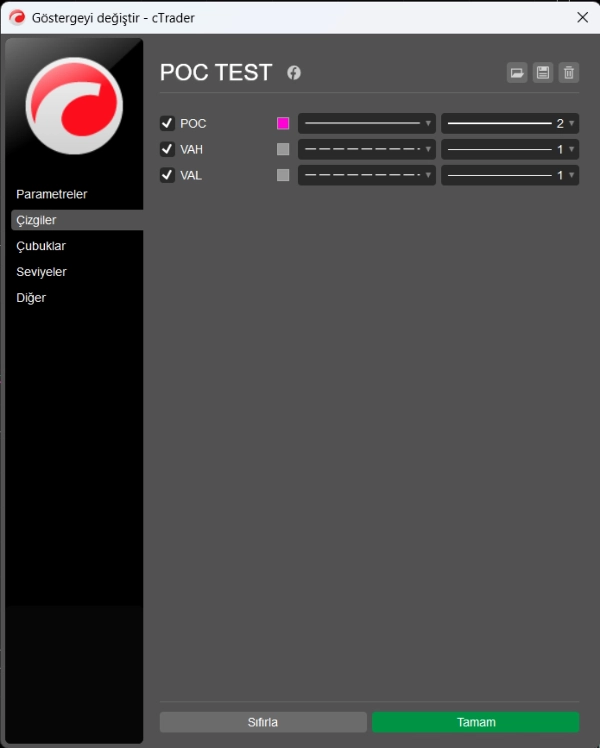
Parametre yapısı kasıtlı olarak basit tutulmuştur. Düzensiz ayarlar yerine sadece temel kontroller dahil edilmiştir. Temiz görünümüne rağmen, gösterge arka planda oldukça rafine bir hesaplama motoru çalıştırır.
İçeride kullanılan bazı hesaplama yöntemleri:
- Hibrit ağırlıklı hacim dağılımı
- Kapanış fiyatı eğilim hesaplaması
- Mum gövdesi ağırlıklandırması
- Sweep / fitil filtreleme mantığı
- Küme tabanlı POC tespiti
- Dinamik POC güç analizi
- Uyarlanabilir Değer Alanı genişletmesi
- Stabilize edilmiş VAH / VAL hesaplaması
- Gürültü azaltılmış histogram oluşturma
- Düşük yükte gerçek zamanlı yeniden hesaplama
Not:
- Basitlik ve kararlılık amacıyla, parametre seti kasıtlı olarak sınırlı tutulmuştur. Daha gelişmiş özelleştirme seçeneklerine ihtiyaç duyan kullanıcılar doğrudan benimle iletişime geçebilir. Gelecekte onlar için özel bir gelişmiş sürüm yayınlanabilir.
Özet
Users can drag the start line to select the desired candle, with an optional duration limit setting. The line snaps to candles to prevent misalignment. Multiple independent profiles can be created on the same chart using different instance IDs.
The POC line uses three colors to indicate strength: white for weak, yellow for balanced, and magenta for strong POC. Internally, the indicator employs advanced calculation methods including hybrid weighted volume distribution, close-price bias, candle body weighting, wick filtering, cluster-based POC detection, dynamic POC strength analysis, adaptive value area expansion, stabilized VAH/VAL calculation, noise-reduced histogram generation, and low-overhead real-time recalculation.
The parameter set is minimal, focusing on essential controls to maintain a clean chart appearance without excessive resource consumption. This indicator supports visualization of volume profiles with key market structure levels for enhanced volume-based analysis.