present
ลงทะเบียนและรับส่วนลด $50 สำหรับการซื้อครั้งแรกของคุณ
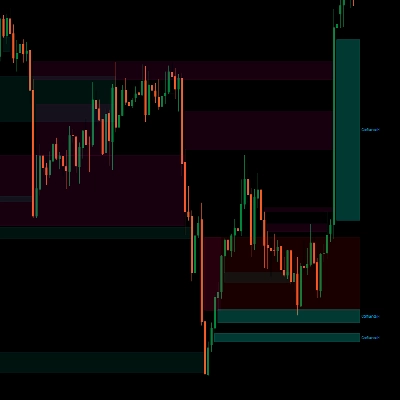
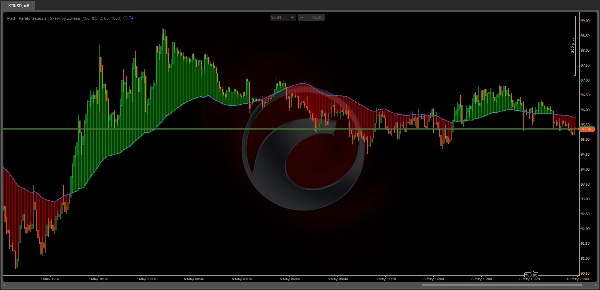
Trading product for PGS - Pareto Gaussian Skew by Zofesu อินดิเคเตอร์ EMA Supertrend, image 1
PGS - Pareto Gaussian Skew by Zofesu
อินดิเคเตอร์
เวอร์ชัน 1.0, May 2026
Windows, Mac
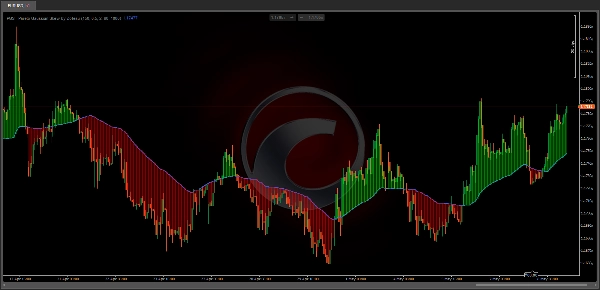
Trading product for PGS - Pareto Gaussian Skew by Zofesu อินดิเคเตอร์ EMA Supertrend, image 2
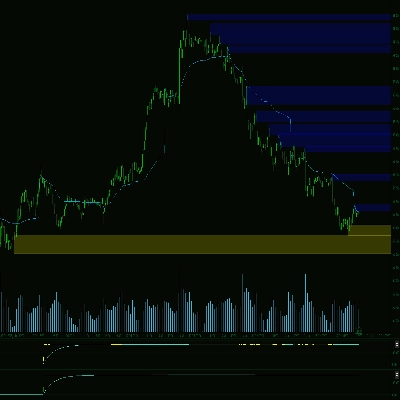
Trading product for PGS - Pareto Gaussian Skew by Zofesu อินดิเคเตอร์ EMA Supertrend, image 3
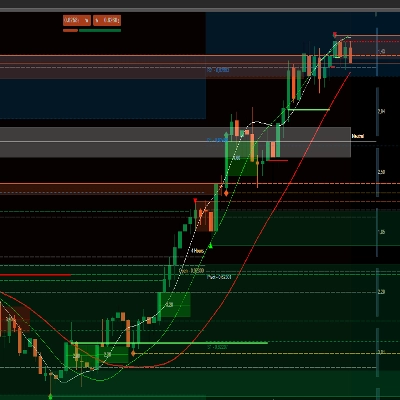
Trading product for PGS - Pareto Gaussian Skew by Zofesu อินดิเคเตอร์ EMA Supertrend, image 4
Trading product for PGS - Pareto Gaussian Skew by Zofesu อินดิเคเตอร์ EMA Supertrend, image 5
Trading product for PGS - Pareto Gaussian Skew by Zofesu อินดิเคเตอร์ EMA Supertrend, image 6
ตั้งแต่ 01/12/2025
280
ติดตั้งฟรี

คำอธิบาย

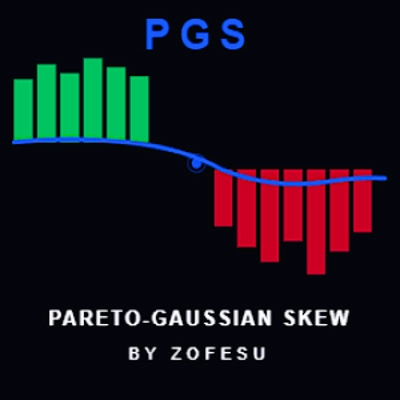
📊 PGS — Pareto-Gaussian Skew by Zofesu — Institutional Gravity Line & Tension Cloud. PGS is a precision overlay indicator built on two mathematical principles: the Gaussian distribution and the Pareto 80/20 rule. It identifies the invisible gravitational center of price — filtering out noise and focusing only on the 20% of moves that drive 80% of the trend.

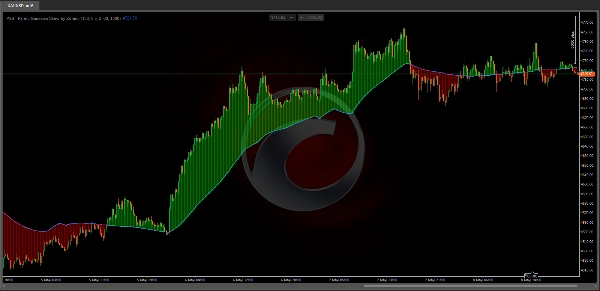
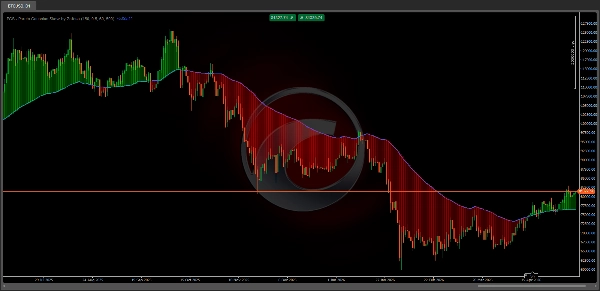
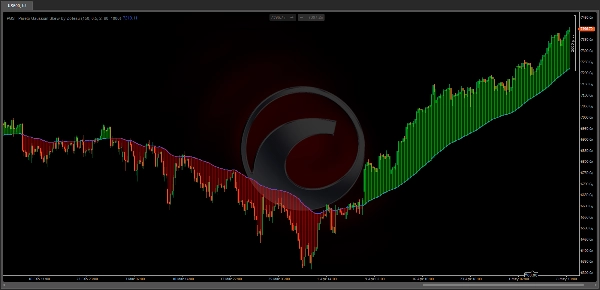
⚙ HOW IT WORKS The indicator calculates a dynamic baseline (SMA) and standard deviation over a configurable lookback window. Only price moves that exceed one standard deviation are considered statistically significant — these represent institutional displacement, not random noise. The Pareto Skew Factor amplifies these extreme moves and feeds them into an EMA smoother, producing a stable gravity line that adapts to market structure. The Tension Cloud fills the space between price and the gravity line: Green cloud (price > PGS line) — price is above gravity, bullish bias Red cloud (price < PGS line) — price is below gravity, bearish bias The wider the cloud, the more extended price is from its statistical center — a potential reversion zone.

🔑 KEY FEATURES
✅ Pareto-Gaussian gravity line — filters noise, reacts only to institutional moves
✅ Dynamic Tension Cloud — visualizes distance between price and gravity center
✅ Configurable Skew Factor — control sensitivity to extreme price displacement
✅ Adjustable lookback (Smith's Memory) — 20 to 500 bars
✅ Custom cloud colors and opacity — full visual control
✅ Max Cloud Bars limit — performance-optimized rendering
✅ Lightweight C# — no performance impact

📚 HOW TO USE

  1. Add PGS to any chart and timeframe
  2. Watch the PGS blue line — this is your gravity center
  3. Green cloud = price above gravity → look for long setups or trend continuation
  4. Red cloud = price below gravity → look for short setups or trend continuation
  5. Wide cloud = price is extended → potential mean reversion zone, reduce position size or wait
  6. Price crossing the PGS line = gravity shift → potential trend change
  7. Use in confluence with S/R levels, VWAP, or volume signals

Works on any TimeFrame and Asset: Indices (NAS100, SPX500), Forex, Gold, Crypto

🔗 PARAMETERS

  • Smith's Memory (Lookback) — statistical window for SMA and StdDev calculation (default 150, range 20–500)
  • Pareto Skew Factor — weight of extreme moves in gravity calculation (default 0.5, range 0.1–1.0)
  • PGS line thickness can be adjusted via right-click → Format on the indicator or Properties → lines (default 2)
  • Cloud Opacity (0–200) — transparency of the Tension Cloud (default 60, 0=Off)
  • Max Cloud Bars — maximum number of bars rendered for the cloud (default 500)
  • Bull Cloud Color — color when price is above gravity (default green)
  • Bear Cloud Color — color when price is below gravity (default red)

📝 NOTES

  • Higher Skew Factor (0.8–1.0) = gravity line reacts more aggressively to institutional moves
  • Lower Skew Factor (0.1–0.3) = smoother, more conservative gravity line
  • Higher Lookback = slower, macro-level gravity center
  • Lower Lookback = faster, more reactive to recent price action
  • Max Cloud Bars upper limit is 2000. Values above 1000 may impact performance. On lower timeframes (M5 and below) use 300 or less.

⚠️ DISCLAIMER Trading financial instruments involves substantial risk of loss. Past performance of any indicator or strategy does not guarantee future results. This tool is provided for informational and educational purposes only. Always use proper risk management and never risk more than you can afford to lose. The author is not responsible for any trading losses incurred through the use of this indicator.

สรุป

โปรไฟล์อินดิเคเตอร์
หมวดหมู่อินดิเคเตอร์
โครงสร้างตลาด (SMC)
ประเภทเอาต์พุต
การแสดงเป็นภาพ
ข้อกำหนดด้านข้อมูล
แท่งเท่านั้น
สัญญาณที่รองรับ
ความแข็งแกร่งของแนวโน้ม
แตะ Level ที่ระบุ
เบรก Level ที่ระบุ
Reversal

การสนทนา

รีวิวจากลูกค้า

0.0
รีวิว: 0
รีวิวจากลูกค้า
ยังไม่มีรีวิวสำหรับผลิตภัณฑ์นี้ หากเคยลองแล้ว ขอเชิญมาเป็นคนแรกที่บอกคนอื่น!

คำถามที่พบบ่อย

EMA
Supertrend
Key Levels
MSS
Volume
Market Structure
VWAP
ผลิตภัณฑ์ที่มีให้บริการผ่าน cTrader Store รวมถึงบอทการเทรด อินดิเคเตอร์ และปลั๊กอิน มีให้บริการโดยนักพัฒนาบุคคลที่สามและมีไว้เพื่อวัตถุประสงค์ในการเข้าถึงข้อมูลและทางเทคนิคเท่านั้น cTrader Store ไม่ใช่โบรกเกอร์และไม่ได้ให้คำแนะนำการลงทุน คำแนะนำส่วนบุคคล หรือการรับประกันผลการดำเนินงานในอนาคต

เพิ่มเติมจากผู้เขียนคนนี้
อินดิเคเตอร์
VWAP
Forex
+7
VWAP + Swing Liquidity + SFP Signals — detects liquidity sweeps with color-coded alerts.
อินดิเคเตอร์
SMC
Forex
+5
Fear & Greed engine — detects institutional overheating with BB + Percentile signals.

นอกจากนี้คุณยังอาจชอบ

อินดิเคเตอร์
Prop
Forex
+11
Ultimate Session Tool: Boxes, OR, KZs, PD Levels, Overlaps, Custom Lines & Names, Info Panel! Highly customizable 📉📈
อินดิเคเตอร์
BOS
CHOCH
+3
Identifies HH, HL, LH, and LL swing points using fractals. Essential for Smart Money Concepts and price action.
อินดิเคเตอร์
Fair Value Gap
Liquidity Grab
+2
PRO Liquidity Sweep + FVG Combo detector with custom Gold/Blue signals & alerts
อินดิเคเตอร์
VWAP
Support & Resistance
Trading.FC$_vwap Algo shows VWAP trends, dynamic support/resistance and deviation bands to spot potential trade entries.
"Stochastic Momentum Index" โลโก้
เรตติ้งสูง
4.2
(4)
$19
/
$20
อินดิเคเตอร์
Prop
Forex
+14
Stochastic Momentum Index (SMI) for cTrader optional higher-timeframe source, and clear overbought/oversold levels.
อินดิเคเตอร์
Drawdown Monitor
Protect your funded account. Real-time Daily Equity Drawdown monitor with Green / Orange / Red flashing alerts.
"Trend Sniper" โลโก้
ยอดนิยม
4.3
(3)
$19
/
$29
อินดิเคเตอร์
Prop
Forex
+9
Trend Sniper — session-based tool highlighting live session ranges and adaptive Custom line.
อินดิเคเตอร์
Breakout
3 bar triangle = high below 2 day high, low above 2 day low
อินดิเคเตอร์
Prop
Institution-level trend Analyzer.
อินดิเคเตอร์
Pin Bar
Inducement
+5
Institutional Nasdaq Session Liquidity Map with Live Point HUD, Sweep Alerts & Interactive Playbook.
อินดิเคเตอร์
Forex
Indices
+1
Professional Fair Value Gaps with multitimeframe spot on
อินดิเคเตอร์
This is the trial version of Time To Break Even, which help you time your trade entry.
อินดิเคเตอร์
RSI
VWAP
+3
Asia, London & NY sessions mapped in real time, boxes, VWAP, kill zones, range extensions, and a built-in RSI panel.
อินดิเคเตอร์
AI
SMC
+5
Coloring trendline/ Colored Trendline / Color Trendline
อินดิเคเตอร์
Key Levels
Liquidity Grab
+2
The levels you mark each morning, drawn and followed: PDH/PDL, weekly, monthly, sessions, equal highs/lows.
อินดิเคเตอร์
BOS
EMA
+5
VWAP Bands indicator with 3 standard deviation levels, buy/sell zones, and a draggable ON/OFF button to toggle the entir
อินดิเคเตอร์
Supply and demand zones. They're important. Here's a free version to get you started!
อินดิเคเตอร์
Grid
Prop
+16
Those who are involved in trading know how important it is to take into account the previous session. With Order Block

ราคา

ตั้งแต่ 01/12/2025
280
ติดตั้งฟรี